

Learn with Us
- Investing: Basics
- Types Of Investment Instruments
- What exactly is the stock exchange?
- Stock Market Regulators
- What Is An Initial Public Offering (IPO)?
- What Is Depository?
- Market Jargons
- Fundamental Analysis
- What is an annual report?
- Financial Statements
- The profit and loss statement
- Balance Sheet
- The Cash Flow statement
- Financial Ratio
- What are futures
- Important Futures Contract Terminology
- Index Futures and Stock Futures
- Futures Payoffs
- Margins
- Long and short futures
- Rollover
- Hedging
- Physical Settlement
- Option
- Call options
- Call option seller
- Put Option
- Put option seller
- Moneyness of an Option Contract
- The Option Chain
- What are Option Greeks?
- Personal Finance Basics
- Process:
- Financial Planning Pyramid
- Cash Flow Analysis (Current Status)
- Current Asset Allocation
- Risk profiling
- Emergency funds
- Investment Planning for Goals
- Insurance
- The Fundamentals of Income Tax Structure in India
- Mutual Fund
- Mutual Fund Ratios
- Mutual Fund Types in India
- Mutual Fund Schemes
- What exactly is an Exit Load, and why is it imposed?
- Mutual Fund Jargons
Option

It is a contract in which one party (the holder or buyer) has the right, but not the responsibility, to execute the contract (the option) on or before a specific date in the future (the exercise date or expiry). The other party (the writer or seller) is obligated to honor the contract's stipulated feature.
Buying and selling options contracts in the F&O market is the most basic options trading method. It involves two parties: the option writer and the option buyer. Technically, the writer is taking on extra risk. As a result, he obtains a premium, which the buyer must pay. It assures that if the market turns against the writer and the options contract expires worthless, the buyer's losses do not exceed the premium paid.
Options are classified as 'call' or 'put.'
Let's go through the fundamentals of call and put options and try to comprehend how they work.
Call options

Call options provide the buyer the right to acquire the underlying asset at a certain price on a specific day. Meanwhile, if the buyer chooses to exercise his right, the seller is compelled to sell the item at the predetermined price on the predetermined day.
An example of a call optionA call option grants the option buyer the right to purchase an asset. The seller of the option, on the other hand, has no such right and is required by the option contract to sell the asset to the buyer (if the buyer exercises his right to purchase).
In exchange for effectively giving up his rights, the seller of the option charges the option buyer a fee known as the 'premium.' Consider this 'premium' amount to be a form of security deposit charged by the option seller to compensate himself if the buyer does not exercise his option.To further understand the concept of call options, consider the following example.
Assume Reliance is currently trading at Rs. 2500. You anticipate that the price of this stock will rise in the near future, say one month from now. So you want to lock in the present price today so that you can buy at this cheap price later.
However, you are naturally cautious, so you want to account for the other scenario as well - what if prices decrease instead? So, in essence, you want the option (rather than the duty) to purchase Reliance at Rs. 2500 in the future.
This is where an options contract can come in handy. A call option is a type of options contract that offers you the right to acquire an asset at a preset price on a future date.
Meanwhile, another trader, Yagya, believes that the price of Reliance shares would fall in the near future. In other words, he wants to engage into a contract that will allow him to sell the share one month later at Rs. 2500 since he feels the prices will be significantly lower at that time.
This price (Rs. 2500) is known as the strike price of the option.
So the two of you sign a contract. Yagya sells you a call option. In other words, you buy the right to buy a Reliance share from him one month from today for Rs. 2500.
You anticipate that the price will be more than Rs. 2500 at that point. Meanwhile, Ram sells you the right to buy a share of Reliance for Rs. 2500.
You are both the buyer of the options contract and the buyer of the asset in this case. And Yagya is the seller of both the options contract and the asset.
As a result, Yagya has effectively obligated himself to sell you the shares. Yagya will charge you a premium of say Rs. 20 as compensate for any loss he may experience if you do not exercise your choice.
We will attempt to formalise our thinking on the call option and gain a solid understanding of both the buying and selling of the call option.
Before we go any further, here is a quick rundown of call option buyer
- • When you expect the underlying price to rise, it makes sense to purchase a call option.
- • If the underlying price remains unchanged or falls, the buyer of the call option loses money.
- • The money lost by the buyer of the call option is equal to the premium (agreement fees) paid to the seller/writer of the call option.
For sake of understanding let’s take example of HUL,

It has been beaten down from its September highs and made a low of 1900 levels which is quite unsustainable for it; as results have been favourable so you decided to buy a call option of 2000 strike price of may month ,as you want least premium decay.
Now lets say you bought it at 80 , your payoff on expiry would be as follows , based on the intrinsic value of the option.
| HUL price | Buy Price | Intrinsic Value | PnL |
|---|---|---|---|
| 1850 | 80 | 0 | -80 |
| 1900 | 80 | 0 | -80 |
| 2000 | 80 | 0 | -80 |
| 2100 | 80 | 100 | 20 |
| 2200 | 80 | 200 | 120 |
| 2300 | 80 | 300 | 220 |
Intrinsic value for a Call Option is calculated as
INTRINSIC VALUE =CURRENT PRICE – STRIKE PRICE
Note: Intrinsic Value can never be negative/ less than zero. Now consider why intrinsic value cannot be less than zero.
We know that the highest amount of money you can lose in option buying I restricted to the amount of premium paid. It is because options contracts allow traders to choose whether or not to exercise the contract. A trader will only exercise an option or make a decision if it is profitable for him. If he is losing money, he will let the options expire worthless and lose the price paid for the option. He will not lose any more money than the premium paid when he purchased the contract.
So, we may conclude that the maximum loss for an option buyer is limited whereas the maximum profit for him is unlimited; the break even for him would be equal to premium paid in addition to the strike price.
Call option seller
However, keep in mind that whatever occurs to the option seller in terms of the P&L, the exact reverse happens to the option buyer and vice versa. For example, if the option writer profits Rs.70/-, this automatically implies that the option buyer loses Rs.70/-.
Here's a quick rundown of some of them:
- • If the option buyer's risk is restricted (to the extent of the premium paid), the option seller's profit is also limited (again to the extent of the premium he receives)
- • If the option buyer has an endless profit potential, the option seller may have an unlimited risk.
- • The breakeven point is the moment at which the option buyer begins to profit; it is also the point at which the option writer begins to lose money.
- • If the option buyer makes Rs.X in profit, it indicates that the option seller loses Rs.X.
- • If the option buyer loses Rs.X, it means that the option seller profits Rs.X.
- • Finally, if the option buyer believes that the market price will rise (above the strike price in particular), the option seller believes that the market price will remain at or below the strike price...and vice versa.
If we consider the same example with sellers’ point of view, the PnL would be something like this: -
| HUL price | Buy Price | Intrinsic Value | PnL |
|---|---|---|---|
| 1850 | 80 | 0 | 80 |
| 1900 | 80 | 0 | 80 |
| 2000 | 80 | 0 | 80 |
| 2100 | 80 | 100 | -20 |
| 2200 | 80 | 200 | -120 |
| 2300 | 80 | 300 | -220 |
We can conclude from here that the profit of a call option seller is capped at 80 but his losses can run down to infinity. A call option buyer will earn a profit till price at expiry is less than premium paid in addition to Strike price which is 2000+80 for HUL.
Albeit your max profit is fixed at 80, but your losses aren’t.
Put Option
A put option (or "put") is a contract that grants the option buyer the right, but not the responsibility, to sell a predetermined amount of an underlying securities at a predetermined price within a predetermined time frame. The striking price is the predetermined price at which the buyer of the put option can sell the underlying security.
The buyer's outlook on markets should be negative in a put option, as opposed to the buyer's bullish view in a call option.
A put option agreement allows the buyer to purchase the right to sell a stock at a predetermined price (strike price), regardless of the current trading price of the underlying.
Remember this generalisation: whatever the buyer of the option anticipates, the seller anticipates the exact opposite, implying the existence of a market. After all, a market cannot exist if everyone expects the same thing. So, if the Put option buyer anticipates the market to fall before expiration, the Put option seller expects the market (or the stock) to rise or remain flat.
A put option buyer purchases the right to sell the underlying to the put option writer at a set price (Strike price). This means that the put option seller will have to buy if the 'put option buyer' is selling him at expiry. Take note: at the time of the agreement, the put option seller is selling a right to the put option buyer to 'sell' the underlying to the 'put option seller' at the time of expiry.
Confusing? Consider the 'Put Option' to be a simple contract in which two parties meet today and agree to enter into a transaction based on the price of an underlying asset: -
The party agreeing to pay a premium is referred to as the 'contract buyer,' while the party receiving the premium is referred to as the 'contract seller.'
The contract buyer pays a premium to acquire a right.
The contract seller receives the premium and becomes obligated.
On the expiry day, the contract buyer will determine whether or not to exercise his entitlement.
If the contract buyer exercises his right, he is entitled to sell the underlying (perhaps a stock) at the agreed-upon price (strike price), and the contract seller is compelled to purchase the underlying from the contract buyer.
Obviously, the contract buyer will exercise his right only if the underlying price is trading below the strike price – this means that the buyer can sell the underlying at a much higher price to the contract seller despite the fact that the same underlying is trading at a lower price in the open market.

Tata Power was trading at all time high, but it started showing some weakness at the top , at first we assumed that it may be some profit booking , but on 18-04-2022 both indices opened lower and Tata Power broke its major support , it consolidated around 250 levels which is also an important area , but weakness persisted. So on this rational lets say you took a trade with Options, You bought 250 PE at 5, when tata power was trading at 260
| TATA Power Price | Buying PRICE | INTRINSIC VALUE | PnL |
|---|---|---|---|
| 280 | 5 | 0 | -5 |
| 270 | 5 | 0 | -5 |
| 270 | 5 | 0 | -5 |
| 260 | 5 | 0 | -5 |
| 250 | 5 | 0 | -5 |
| 240 | 5 | 10 | 10 |
| 230 | 5 | 10 | 20 |
If you will look at this you will find that Maximum Loss is Capped at 5 but maximum profit potential is unlimited(or limited to the extend till the underlying erodes its value to zero).
Intrinsic Value for a Put Option equals to Strike Price – Current Price.
Option Buyer will start making money after the current market price is less than the premium paid in addition to the strike price.
Put option seller
However, keep in mind that whatever occurs to the option seller in terms of the P&L, the exact reverse happens to the option buyer and vice versa. For example, if the option writer profits Rs.7/-, this automatically implies that the option buyer loses Rs.7/-.
Here's a quick rundown of some of them:
- • If the option buyer's risk is restricted (to the extent of the premium paid), the option seller's profit is also limited (again to the extent of the premium he receives)
- • If the option buyer has an endless profit potential, the option seller may have an unlimited risk.
- • The breakeven point is the moment at which the option buyer begins to profit; it is also the point at which the option writer begins to lose money.
- • If the option buyer makes Rs.X in profit, it indicates that the option seller loses Rs.X.
- • If the option buyer loses Rs.X, it means that the option seller profits Rs.X.
- • Finally, if the option buyer believes that the market price will rise (above the strike price in particular), the option seller believes that the market price will remain at or below the strike price...and vice versa.
If we consider the same example with sellers’ point of view, the PnL would be something like this: -
| TATA Power Price | Buying PRICE | INTRINSIC VALUE | PnL |
|---|---|---|---|
| 280 | 5 | 0 | 5 |
| 270 | 5 | 0 | 5 |
| 270 | 5 | 0 | 5 |
| 260 | 5 | 0 | 5 |
| 250 | 5 | 0 | 5 |
| 240 | 5 | 10 | -10 |
| 230 | 5 | 10 | -20 |
We can conclude from here that the profit of a put option seller is capped at 5 but his losses can run down to infinity. A put option buyer will earn a profit till price at expiry is less than premium paid in addition to Strike price which is 245 for TATA Power.
Albeit your max profit is fixed at 5, but your losses aren’t.
Moneyness of an Option Contract
An option contract's moneyness is a categorization approach in which each option (strike) is classed as either, In the money (ITM), At the money (ATM), or Out of the money (OTM). This classification assists traders in determining which strike to trade given a specific market situation.
This classification is based upon current market price/ spot price of the underlying and intrinsic value of options.
Intrinsic Value of a Call option = Spot Price – Strike Price
Intrinsic Value of a Put option = Strike Price – Spot Price
Understanding strike classification, is fairly simple. All you have to do is calculate the intrinsic value. If the intrinsic value is greater than zero, the option strike is deemed 'in the money.' If the intrinsic value is zero, the option strike is referred to as being 'out of the money.' The strike that is closest to the Spot price is referred to as 'At the money.'
The Option Chain
The option chain is a feature found on the majority of exchanges and trading platforms. The option chain is a form of quick reckoner that helps you find all of the strikes that are available for a specific underlying and categorises the strikes based on their moneyness. Furthermore, the option chain offers information such as the Last Traded Price (LTP), volumes, open interest, and so on for each option strike.

This is option chain of Nifty, after observing we can conclude the following–
- 1. The Call options are located on the option chain's left side.
- 2. The Put options are located on the option chain's right side.
- 3. In the centre of the option chain, the strikes are stacked in increasing order.
- 4. All option strikes lower than ATM options are ITM options for call options. As a result, they have a pale-yellow background.
- 5. All option strikes higher than ATM options are OTM options for Call options. As a result, they have a white background.
- 6. For Put Options, all option strikes greater than ATM are ITM. As a result, they have a pale-yellow background.
- 7. For Put Options, any option strikes less than ATM are OTM. As a result, they have a white background.
- 8. The pale yellow and white background is simply a segregation tool for separating the ITM and OTM possibilities.
What are Option Greeks?
These are distinct measurements that help traders understand how the price of an options contract reacts to various influencing circumstances. They are also known as options Greeks. Greeks have three primary possibilities, which are outlined below

- • Delta
- • Gamma
- • Theta
- • Vega
Delta
You are aware that an options contract is a type of derivative. That is, its value is derived from the underlying asset. So, if the underlying asset's price changes, the price of the options contract (or its premium) changes, right? The delta measures the change in the premium of an option contract.
Delta: MeaningTechnically, the delta of an options contract is defined as the rate of change in the option's price in relation to changes in the underlying asset's price. It represents an option's directional risk.
What exactly is directional risk? That is, the delta indicates how much the price of an option will vary when the price of the underlying asset changes in a specific way (up or down).
The option price of a call option rises as the price of the underlying asset rises (and vice versa). The option price for a put option falls as the underlying asset's price rises (and vice versa).
In other words, the call option's price goes in the same direction as the underlying asset's price, but the put option's price moves in the opposite direction.
Here's an example to help you understand. Consider call and put options with ITC’s shares as the underlying asset.
| A | B | C | D | E |
|---|---|---|---|---|
| Type of option | Option price(in rupees) | Option delta | Option price if the share price increases by Re. 1 (in rupees)(B+C) | Option price if the share price decreases by Re. 1(in rupees)(B-C) |
| Call | 5.00 | +0.75 | 5.75 | 4.25 |
| Call | 2.50 | +0.30 | 2.80 | 2.20 |
| Put | 3.00 | -0.25 | 2.75 | 3.25 |
| Put | 4.00 | -0.60 | 3.40 | 4.60 |
A call option's delta is always between 0 and 1. (same direction movement).
And the delta of a put option is always between 0 and -1. (opposite direction movement).
And the delta of a put option is always between 0 and -1. (opposite direction movement).
The delta of an options contract is always changing. It also does not fluctuate in a linear fashion. So, how do you evaluate this delta change? This is when gamma comes in handy.
The definition of gammaThe gamma of an options contract is defined as the rate of change in the option's delta in response to changes in the underlying asset's price. In other words, it is the projected change in an option's delta relative to 1-rupee fluctuations in the underlying asset's price. It denotes a shift in the directional risk of an option.
To understand gamma, we must first examine how the delta of an option varies when the underlying asset's price changes. This is the typical trend for delta change.
When the asset's price rises, the delta of a call option rises as well (and vice versa).
When the asset's price rises, the delta of a put option decreases (and vice versa).
In other words, the delta of a call option moves in the direction of the underlying asset's price, but the delta of a put option travels in the other way.
Here’s an example to make things clearer:
*black and Scholes calculator(option pricing calculator)
| A | B | C | D | E |
|---|---|---|---|---|
| Type of option | Original delta | Gamma | New delta if the share price increases by Re. 1(B+C) | New delta if the share price increases by Re. 1(B+C) |
| Call | +0.50 | +0.05 | +0.55 | +0.45 |
| Call | +0.10 | +0.02 | +0.12 | +0.08 |
| Put | -0.25 | +0.04 | -0.21 | -0.29 |
| Put | -0.40 | +0.10 | -0.30 | -0.50 |
Theta:
The premium you pay for an options contract is made up of two parts: extrinsic value and intrinsic value.
The extrinsic value of an option is made up of its time value and implied volatility. As the contract's expiration date approaches, the time value of an option diminishes. As a result, the extrinsic value decreases. As a result, the premium (or option price) decreases. This is known as time decay, and the option theta aids in calculating it.
Premium of an option = extrinsic value + intrinsic value
Theta is defined as the daily price decay of an option as the expiry date approaches. It aids in calculating the predicted drop in option premium with each passing day. Let's look at an example to better comprehend this notion.
| A | B | C | D |
|---|---|---|---|
| Initial price of the option (in rupees) | Theta | Expected option price after 1 day (A-B) | Expected option price after 10 days [A-(B x 10)] |
| 10.00 | -0.25 | 9.75 | 7.50 |
| 2.50 | -0.05 | 2.45 | 2.00 |
| 1.00 | -0.01 | 0.99 | 0.99 |
Vega
Vega is a measure of an option's price sensitivity to changes in the underlying asset's volatility. Vega is the amount by which the price of an option contract varies in response to a 1% change in the implied volatility of the underlying asset.
Fundamental Analysis

Fundamental analysis (FA) is a method of measuring the intrinsic value of a security by examining the relevant economic and financial factors. Fundamental analysts investigate everything that can affect the value of a security, from macroeconomic factors such as economic and industry conditions to microeconomic factors such as the effectiveness of corporate governance.
The ultimate goal is to reach a number that allows investors to see if a security is undervalued or overvalued compared to the current price of the security.
If an investor wants to invest in a company over the long term (e.g. 3-5 years), it is essential to understand the company from different perspectives. It is important for investors to isolate the daily short-term noise of stock prices and focus on the underlying performance. In the long run, the stock prices of fundamentally strong companies tend to rise, bringing wealth to investors.
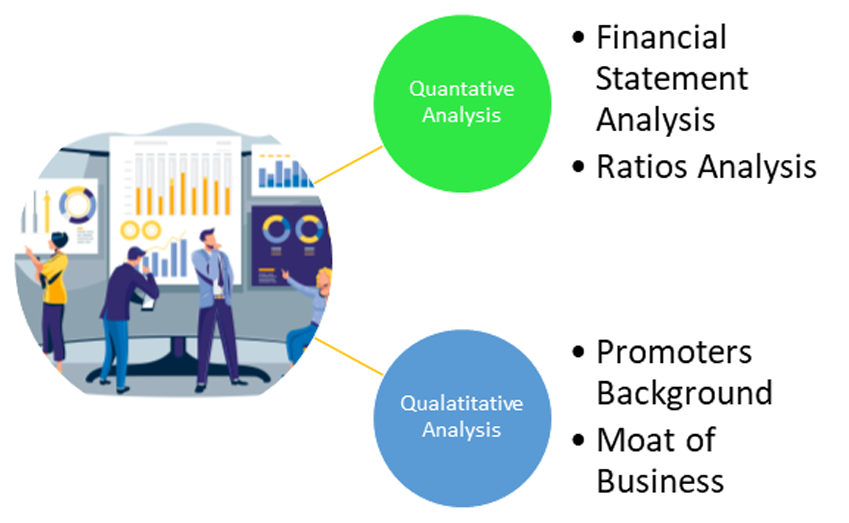
Quantitative and qualitative fundamental analysis
In fundamental analysis, experts use both quantitative and qualitative aspects to determine the intrinsic value of a stock. The following are associated with these aspects:
Quantitative aspects of fundamental analysisThis is information that can be quantified by numerical values such as company sales, profits, liabilities, and assets.
- • What is the enterprise`s revenue?
- • How a whole lot earnings has it made withinside the beyond year?
- • How a whole lot capital does it have
- • How is the enterprise the usage of its cash?
- • What does the enterprise spend on?
- • How a whole lot debt does it owe its creditors?
These are more abstract details such as the company's credit, the patent in its name, and the company's own technology.
- • How efficient are the enterprise`s operations?
- • What is the excellent of its key control personnel?
- • How much is the brand value of the company?
- • Does the enterprise use any proprietary technology?
- • What socially accountable tasks is the enterprise undertaking?
- • What is the enterprise`s imaginative and prescient like for the future?
Tools for Fundamental Analysis
The tools needed for fundamental analysis are basic and most of them are free to use. Specifically, you will need the following:
- • Company Annual Report-All information required for FA can be found in the Annual Report. The annual report can be downloaded free of charge from the company's website.
- • Industry Data – Industry data is needed to see how the companies being reviewed are performing well in their relationships with the industry. Basic data is available free of charge and is usually published on trade association websites.
- • News-Daily News helps you stay up-to-date on the latest developments in your industry and interested companies. Services like good business newspapers and Google Alerts help keep you up to date with the latest news
What is an annual report?
The Annual Report (AR) is the company's annual publication and is sent to shareholders and other stakeholders. The annual report is published at the end of the fiscal year and all data provided in the annual report is dated March 31. AR is usually available as a PDF document on the company's website (investor section). Alternatively, you can contact the company to get a hard copy of it. From the company's annual report, anything listed in Annual Report is considered official. Hence, any misrepresentation of facts in the annual report can be held against the company. To give you a perspective, AR contains the auditor`s certificates (signed, dated, and sealed) certifying the sanctity of the financial data included in the annual report.
Potential investors and the present shareholders are the primary audiences for the annual report.

Infosys annual report 2019-2020
Annual reports should provide the most pertinent information to an investor and communicate its primary message. For an investor, the annual report must be the default option to seek information about a company. Of course, many media websites claim to give financial information about the company; however, the investors should avoid seeking information from such sources. Remember the information is more reliable if we get it to get it directly from the annual report.
Why would the media website misrepresent the company information you may ask? Well, they may not do it deliberately, but they may be forced to do it due to other factors. For example, the company may like to include `depreciation` in the expense side of P&L, but the media website may like to include it under a separate header. While this would not impact the overall numbers, it does interrupt the overall sequencing of data.
Contents of the company's annual report
As you know, the format of the company's annual report is not fixed. This depends on the company. The order of the content can vary, but the core topics of the report are usually the same across organizations. Let's start with the overview section and take a look at the contents of the TATA Power Annual Report.
OverviewThis section of the report provides investors with brief insights into various aspects of the company. Here are some of the subcategories in this section:

1. About the Company
Under this heading, there is usually a short history of the company, including highlights for the past year. In the case of TATA Power, they also talked about brand and product scope, supply chain indicators, and a variety of other information.
2. Chairman's ReportThe Chairman's Report is intended for shareholders of the company and provides information on the development of the company over the past year. In TATA Power’s annual report, the chairman of the company spoke extensively about the company's performance, performance and industry trends.
3. Board of DirectorsThis subsection basically introduces the company's board of directors to shareholders. Includes the name of the director, his position within the company, and his portrait.
4. Management CommitteeThe Management Committee is a group of senior executives responsible for various activities within the company. This subsection contains the names of the members of the committee and their position within the company, as well as their portraits.
5. Company PerformanceThis subsection provides highlights of the company's performance over the past year. This includes both financial and non-financial key performance indicators.
6 Macroeconomic Situation and OutlookThis section of the company's annual report provides an overview of the industries in which the company operates. It also contains information about key trends and economic conditions that affect the company and its stakeholders, and the actions that the company is taking to mitigate the impact. This department. It also outlines both the business and non-business strategies that the company pursues to fulfil its vision and mission.
7. Corporate StrategyThis section contains the company's vision and mission statement. It also outlines both the business and non-business strategies that the company pursues to fulfil its vision and mission.
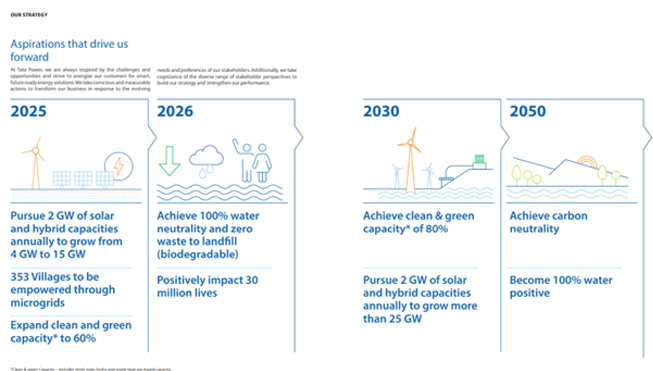
A brief draft or sketch of the company's business model is usually referred to in this section.
Financial Statements
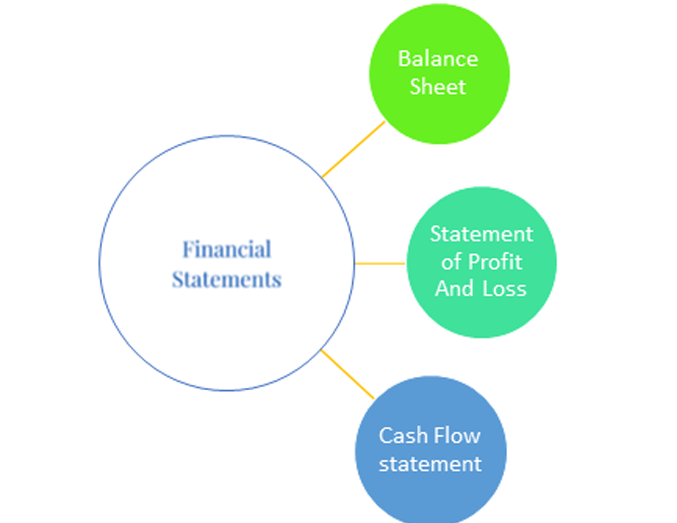
So far, we have only dealt with the qualitative aspects of a company's annual report. With the launch of the financial reporting section, we are officially moving to the quantitative side. Here are some of the company's financial statements that you may encounter in this section of the report:
1. Standalone financial statements
These financial statements relate to a major entity that is Hindustan Unilever Limited in our case. The following are the steps detailed in this section. In the next chapter, you will learn more about how to read and analyse these statements
- o Independent auditors’ report
- o Balance sheet
- o Statement of profit and loss
- o Statement of changes in equity
- o Statement of cash flows
- o Notes
2. Consolidated Financial Statements
In general, if a company has one or more subsidiaries, prepare consolidated financial statements that include financial information for the parent company and its subsidiaries / subsidiaries. It is created in addition to the separate financial statements
- o Consolidated independent auditors’ report
- o Consolidated balance sheet
- o Consolidated statement of profit and loss
- o Consolidated statement of changes in equity
- o Consolidated statement of cash flows
- o Consolidated notes
- o Form AOC-1
Others
This section consists of other information and generally contains the following information:
- o Awards and recognition
- o Corporate information
The profit and loss statement

This is a snapshot of the Tata Power’s income statement from the 2020-2021 annual report. Please read this statement carefully as it is important to understand the layout and structure of your income statement.
Breakdown of profit and loss statement
IncomeIt consists of two major parts
- 1. Revenue from operations: -
You may have heard analysts talking about the company's bottom line. They refer to the revenue side of the income statement. The revenue side is the first number group that the company displays on the income statement.
- 2. Other Income

Expenses are generally categorized by a feature, also known as cost of goods sold, or by the nature of the expense. A list of costs can be found in the income statement or in the appendix. As you can see in the excerpt below, almost all line items have notes associated with them.

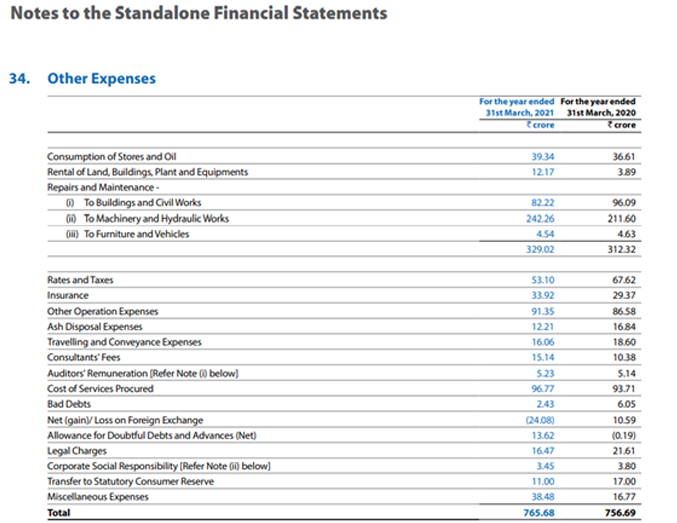
This is the net operating profit after deducting operating expenses and before deducting taxes and interest. Continuing the income statement, you can see that TPCL mentions pre-tax profit and an exceptional number of positions.

Net operating income after tax is defined as operating income after deducting liabilities. Now let's look at the last part of the income statement, profit after tax. This is also known as income statement revenue.

Balance Sheet
The income statement provides information about a company's profitability, while the balance sheet provides information about assets, owners, and capital. As you know, the income statement deals with the profitability of the fiscal year under review. Therefore, it can be said that the income statement is self-contained. However, because the balance sheet is flow-based, it contains financial information from the time the company was established. Therefore, P & L talks about the company's performance in a particular fiscal year. The balance sheet, on the other hand, shows how the company has grown financially over the years.
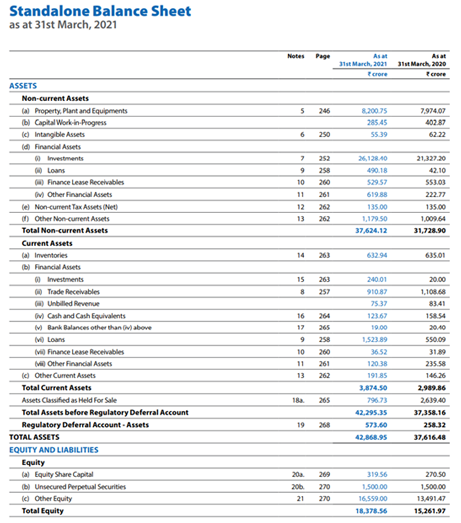
Assets
The assets side of the balance sheet consists of two main categories:
- 1. Current Asset
- 2. Non-Current Assets
Non-Current Assets, often known as long-term investments, are assets that a corporation holds for more than a year. Non-current assets cannot be turned into cash easily or fast. The following non-current assets can be seen in Tata Power's balance sheet.
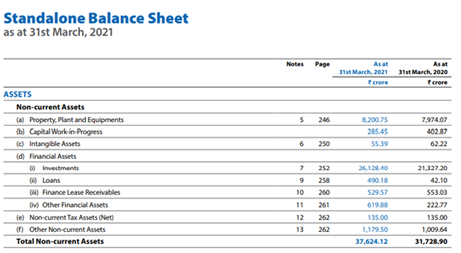
This line item includes all fixed assets owned or leased by the company, such as land, buildings, plant and equipment, furniture and fixtures, and other office equipment. Note 5 is associated with it which reveals all property , plants and equipment owned/ leased by TPCL
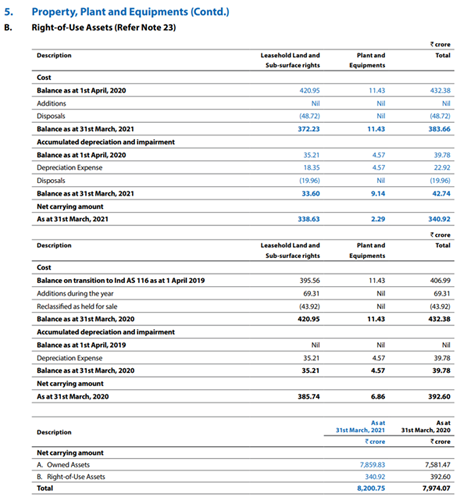
Capital work-in-progress includes all costs involved with the production or building of a fixed asset (CWIP). For example, capital work-in-progress refers to all costs incurred by a corporation in the development of a structure.
Goodwill and other intangible assetsA company's goodwill is essentially its reputation developed over many years of operation. It is typically quantified and presented as an intangible asset on a company's balance sheet.
Financial assetsAll of the company's long-term investments in subsidiaries, affiliated companies, and joint ventures are considered financial assets. Long-term savings, financial market investments, and loans to other businesses are all included.
Non-current tax assets and deferred tax assetsNon-current tax assets and deferred tax assets are two types of long-term assets that can be used by a firm to lower its taxable revenue at a later period. Overpayment of taxes or advance payments of taxes, for example, are categorised as non-current tax assets because they can be utilised to decrease the company's tax burden at a later point.
Other non-current assetsOther non-current assets are used to classify all other ancillary and miscellaneous long-term assets that do not fit into any of the above-mentioned categories.
Current assetsCurrent assets are a company's assets that are expected to be converted into cash within a year. They're also known as short-term assets because they can be sold or converted into cash quickly.
Equity and liabilities

A balance sheet's equity and liabilities are divided into three groups.
- 1. Equity
- 2. Non-current liability
- 3. Current Liability
The following two subdivisions make up the equity heading.
Equity share capital:The whole paid-up value of a company's equity share capital is shown as equity share capital. The notes to financial statements section contains a full breakdown of the equity share capital, including the number of permitted equity shares, the number of issued and paid up equity shares, and the face value of the shares.
Other equity:Other equity balances, such as securities premium and outstanding employee stock options, make up this category. This page also contains all of the company's other reserves, such as capital reserve, capital redemption reserve, and retained earnings. The notes section also contains a breakdown of the various elements under the 'other equity' column of the balance sheet.
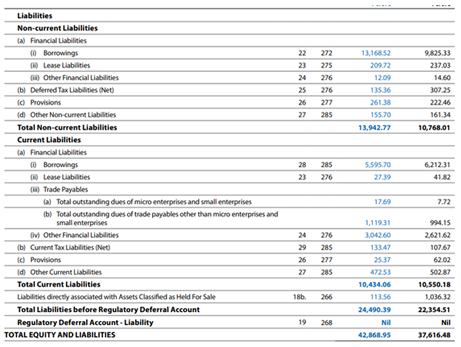
LiabilitiesThe liabilities area of the balance sheet is divided into two sub-categories, similar to the assets section.
- • Non-current liabilities
- • Current liabilities
Non-current liabilities are a company's financial obligations that are not expected to be paid off within a year. Non-current liabilities are difficult to settle and settle fast. The following non-current liabilities can be found in HUL's balance sheet.
Financial liabilitiesThese financial liabilities are a company's long-term debt obligations that must be repaid. Other financial liabilities include ancillary and miscellaneous financial liabilities such as leasing liabilities, employee-related liabilities, and security deposits.
ProvisionsIn its books of accounts, a firm usually makes a provision for an existing or current liability. The corporation is then expected to pay up these provisions in the future. This tab of the balance sheet contains all of the long-term provisions.
Non-current tax liabilitiesNon-current tax liabilities consist of long-term tax liabilities that are required to be borne by the company, but have not yet been paid
Current liabilitiesCurrent liabilities are a company's liabilities that are expected to be paid back within a year. They're also called short-term liabilities because they're usually repaid within a year.
Financial liabilitiesThese financial liabilities, unlike non-current financial liabilities,
include all of a company's short-term obligations. They also contain
trade payables, which are payments that are owed to a company's
suppliers.
Other financial liabilities include supplementary and other short-term
liabilities such as unpaid dividends, salaries, wages, bonuses, and
current leasing payments.
Other current liabilities are used to classify current financial commitments that do not fit into any of the above-mentioned categories. This category includes customer advances as well as statutory dues such as tax deducted at source (TDS) and provident fund payments.
ProvisionsThis tab of the balance sheet contains all of the short-term and current provisions.
Total liabilitiesThe figures on a company's 'equity and liabilities' side of the balance sheet are then added together to get 'total equity and liabilities.
The Cash Flow statement

The cash flow statement is an important financial statement since it shows how much money the company generates. You could wonder why this information isn't included in the P&L statement.
Both cash and credit sales are recognized in the profit and loss statement. If the majority of a company's sales are made in credit, the revenue is recognized, but there is no subsequent cash inflow to the company. This can distort the perception of the company
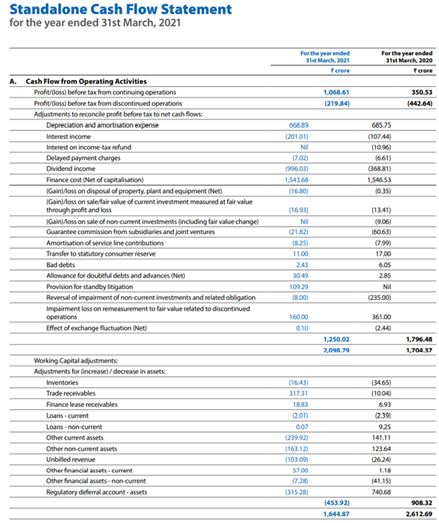
The cash flow statement, as the name implies, summarizes the source and use of cash during the period and calculates the net fluctuations in the company's cash (and cash equivalents). Each entry in the cash flow statement falls into one of three categories:
Operating activities: Cash flows related to the company's key business functions.
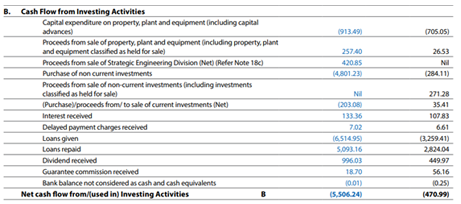
Investment activity: Cash flow from the purchase or sale of fixed assets (plants, tangible fixed assets, etc.).

Financing activities: Cash flows related to a company's financial activities (borrowing from banks, issuing bonds, selling or repurchasing shares, etc.)
Financial Ratios

In many cases, it is easier to calculate the relationships between the various elements of a financial statement rather than looking at individual data points. There are several standardized financial indicators that are used to assess factors such as a company's profitability, efficiency, liquidity, growth potential, and risk. Metrics provide useful information about individual companies and facilitate comparisons between companies of different sizes.
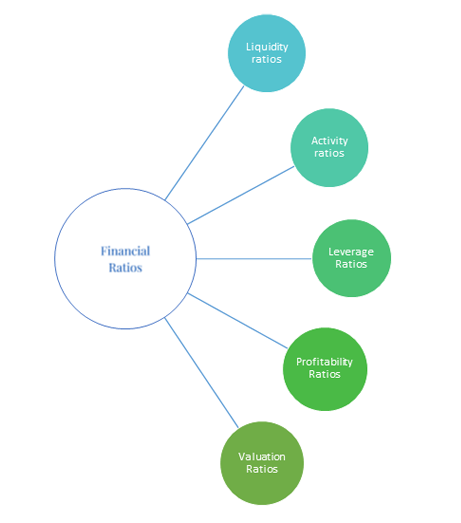
Financial ratios can be classified into different categories, namely:
- 1. Liquidity Ratio
- 2. Activity Ratios
- 3. Leverage Ratios
- 4. Profitability Ratios
- 5. Valuation Ratios
Liquidity Ratio
This indicator provides information about a company's ability to meet short-term financial obligations. This is done by comparing the company's most liquid assets (or assets that can be easily converted to cash) with their current liabilities. In general, the better the cash and short-term debt match, the better the result, as it clearly shows that the company can pay off the debt to be paid in the near future and fund the ongoing business. Companies with low coverage, on the other hand, need to signal investors as they can be a sign that they are having a hard time doing business and fulfilling their debt. The biggest difference between each metric is the type of asset used in the calculation. Each ratio includes current assets, but some liquid assets are excluded because the more conservative ratios are not easy to convert to cash.
Current RatioThe current ratio is a liquidity ratio that assesses a company's capacity to pay short-term or one-year obligations. It explains to investors and analysts how a firm might use current assets on its balance sheet to pay off current debt and other obligations.
Current Ratio= Current Assets/Current Liabilities Quick RatioQuick Ratio = Cash & Equivalents+ short-term investments+ accounts receivables/ Current Liabilities
Operating Ratios
Operating Ratios, also known as "activity ratio" indicate the efficiency of a company's operations. This is another commonly used liquidity indicator related to sales, which indicates how fast goods and payments enter and leave the business, or how quickly non-cash assets are converted. Can be considered to cash. Basically, these key figures show how companies can use their resources efficiently and effectively to generate sales and increase shareholder value. In general, the better these indicators are, the better they are for shareholders.
Inventory Turnover RatioInventory turnover refers to how many times a company's inventory is emptied and replenished during the course of creating the commodities it sells. It compares the total amount of raw materials consumed in a given period to the average amount of inventory kept (COGS).
If a company sells popular products, the goods in its inventory are quickly depleted, and the company must refill the inventory on a regular basis.
Inventory turnover = Cost of goods sold/ Average inventory
Payables Turnover Ratio-This metric indicates how long it takes the company to pay off its accounts payable (in fractions of a year), with days in accounts payable matching to the number of days in the accounting period.
Payables turnover = Cost of goods sold/ Average accounts payable
Receivables Turnover Ratio-Receivables turnover is a metric that indicates how long it takes customers to pay the company in fractional years and days in accounts receivable. A greater figure, of course, suggests that the company collects cash more frequently.
Receivables turnover = Net sales/ Average receivables
Fixed Asset Turnover RatioThis ratio is an approximate estimate of a company's fixed assets' productivity in terms of generating revenue (property, plant, and equipment, or PP&E). Fixed assets are typically the single greatest component of a company's overall assets. This annual turnover ratio is calculated to show a company's efficiency in handling these valuable assets. To put it another way, the larger the annual turnover rate, the better.
Fixed Assets Turnover = Net Sales / Total Average Asset
Leverage Ratios
This series of ratios looks at how leverage (also known as gearing) affects a company's risk. Borrowing money enhances a company's potential returns, but it also raises the company's risk and the potential for earnings fluctuation from one period to the next.
Interest Coverage Ratio : The debt service ratio or debt service coverage ratio is another name for the interest coverage ratio. The interest coverage ratio tells us how much money the company makes compared to how much money it owes in interest. This ratio tells us how easy it is for a corporation to pay its interest. For example, if the company's interest burden is Rs.100 and its income is Rs.400, we can be confident that the company would be able to discharge its debt. A low interest coverage ratio, on the other hand, may indicate a bigger debt burden and a higher risk of bankruptcy or default.
Interest Coverage Ratio = EBIT/ Interest expense
Debt to Equity Ratio: This is a simple ratio to understand. The Balance Sheet contains both of the variables needed for this calculation. It calculates the total debt capital as a percentage of total equity capital. This ratio has a value of 1 if the debt and equity capital are equal. A larger debt-to-equity ratio (more than 1) suggests greater leverage, and so caution is advised. A value less than one suggests a larger equity foundation in relation to debt.
Debt Equity Ratio = [Total Debt/Total Equity]
Financial Leverage RatioThis figure represents the proportion of total assets to total equity. This compares the complete asset base on the balance sheet's left side to simply the fraction of shareholders equity that belongs to common shareholders. The firm's financial leverage, from the perspective of common shareholders, evaluates how much "things" the company has in comparison to how much money they have invested.
Financial Leverage = Total assets/ Total common equity
Profitability Ratios
Profitability ratios assist analysts in determining a company's profitability. The ratios indicate how well a corporation may perform in terms of profit generation. The profitability of a corporation also reflects the management's competitiveness. Profitability is a crucial aspect since earnings are required for business expansion and dividend payments to shareholders.
Gross Profit MarginIt's essentially the profit margin on the company's products, less any production-related indirect costs. The cost of goods sold (COGS) of a corporation represents the costs of labour, raw materials, and manufacturing overhead incurred during the production process. This cost is subtracted from the company's net sales/revenue, yielding the first level of profit, or gross profit.
The gross profit margin is a metric that measures how effectively a corporation uses its raw materials, labour, and manufacturing-related fixed assets to generate profits. A larger profit margin % is a positive indicator.
Gross profit margin = Gross profit/Net sales = (Net sales - Cost of goods sold) / Net sales
Operating Profit Margin/EBIDTA MarginOperating income is calculated by subtracting selling, general, and administrative, or operating expenses from a company's gross profit. Operating expenses are far more under management's control than cost of sales expenditures. As a result, investors must carefully examine the operational profit margin.
The majority of positive and negative developments in this ratio may be traced back to managerial decisions. When conducting inter-company comparisons and financial projections, investment analysts frequently prefer to use a company's operational income figure rather than its net income figure (since it is regarded to be more dependable).
Operating profit margin = Operating profit/ Net sales
Operating Profit = (Net sales - COGS - SG&A expense - D&A) /Net sales
Return On EquityThis is the most important of all financial ratios and the most meaningful measure of return to common stockholders. The return on equity (ROE) quantifies how much a company earns in comparison to the total amount of money left to it by common shareholders (either as paid-in capital from previous share issuances or retained earnings from prior periods).
Return on equity = PAT/Shareholders Fund
Return on Asset (ROA)The ROA is a ratio that compares a company's net income to its total asset base (the entire left side of the balance sheet). This metric measures a company's profitability in relation to its total assets. The return on assets (ROA) ratio shows how well management uses the company's total assets to generate profit. The higher the return, the more effectively management uses its asset base.
Return On Assets = Net income/Average total assets
Return On Capital Employed (ROCE)Except for current obligations, a company's capital employed is everything on the right side of the balance sheet. All long-term funding, minority interests, and shareholders' equity are included. The left side of the balance sheet is used as the reference (because both sides must be equal) and capital employed is defined as:
Capital employed = Total assets - Current liabilities
ROCE = EBIT/ Capital employed
Valuation Ratio
In general, valuation is the estimation of something's 'value.' The price of a stock is referred to as "something" in the context of investments. Regardless of how appealing a business appears, the valuation of the firm is ultimately what matters when making an investment decision. The amount you pay to buy a firm is determined by valuations. A mediocre business with a crazily low valuation might sometimes be a better investment than an interesting business with an incredibly high valuation.
Price to sales ratioThe Price-to-Sales Ratio (P/S) compares the value of a company to the total amount of annual sales it generated previously. The P/S ratio, often known as the "sales multiple," is a valuation multiple based on the market value that investors place on a company's revenue.
Price/Sales Ratio= Market Capitalization/ Annual Revenue
Price to book valueThe Price-to-Book Ratio (P/B Ratio) compares a company's market capitalization to its book value of equity. The P/B ratio, popular among value investors, can be used to find cheap companies in the market.
Price-to-Book Ratio (P/B) = Market Capitalization / Book Value of Equity
Price to earningThe price-to-earnings ratio is a metric that represents a company's profit potential. The value paid by equity investors for each stock unit is used to calculate this potential. As a result, it shows whether a stock is cheaper or more expensive than its competitors in the same industry. In order to track the company's growth, the current price-to-earnings ratio can be compared to previous ratios.
P/E Ratio = Share Price/Earnings Per Share
Personal Finance Basics

When you think about personal finance, you frequently think about organising your finances today so that you can have a better tomorrow. While some assume they can do it themselves, few seek a financial expert to set this course for them. However, I'm not a supporter of seeking a financial planner to assist you map out a strategy for yourself and your family. You and your family should be able to achieve this.
After all, you are the most familiar with your family and their needs. You understand what is beneficial to the family and what is not. You work hard for your family now and wish for them to have a stable future.
Your 'Financial Advisor' will not do any of this.
He is most likely ready to sell you a financial product that will make him a good profit. He will do the same for you and any other 20 clients he may have.
But you should take help of a good financial advisor when you want to invest into instruments about which your understanding is very little.
This module will guide you to the process of financial planning from an individual’s perspective.
In bookish terms financial planning is an ongoing process to help you make sensible decisions about money that can help you achieve your goals in life, which is pretty much true as you can’t live without money , unless you are a monk who has renunciated everything.
Being a process there are some steps involved with it,
Process:
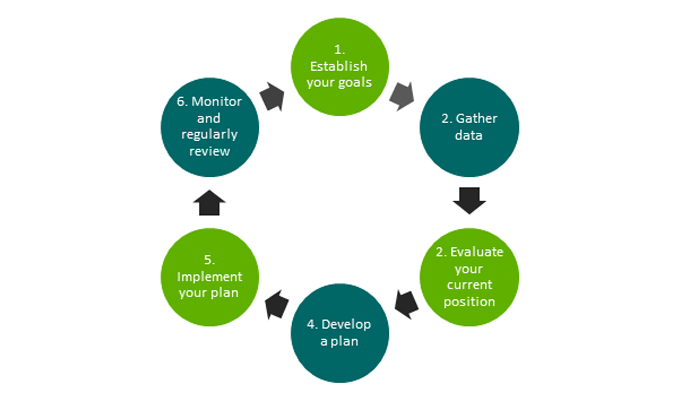
At foremost before making any financial plan you need to establish your goals
For sake of understanding these could be your list of goals
- 1. To buy a luxury car.
- 2. To buy a vacation/first home.
- 3. Your daughter’s marriage
There could be as many as you like to add to your list but remember to be sensible, you can’t make goals like buying land on mars (until elon musk or someone else make that possible).
After making those goals try to gather information about how much it will cost you to achieve those goals, remember you have to take care of every expect of it
For buying a luxury car you need a corpus of around 50,00,000 at least; for buying a decent 4-5 BHK home for your family or to build an independent home even in your home town or whether you want to buy a vacation home at a decent place you will require a corpus of around 1-4 crore.
The big fat Indian wedding will cost you around 1,00,00,000 or even you and your daughter have decided to make it a normal budget friendly ceremony you still have to keep a budget around 50,00,000. (These figures are just estimations you have to gather this information by yourself ; monetary figures are totally subjective in nature).
After you have decided the figures, analyse you current financial position, for that you may use your our calculators such as:
Net worth calculatoras you have correctly estimated the figures you now need to develop a plan, again let’s assume your children are young and you want to save money for their future it could be for marriage, it could be for their education and it could be to help them settle a business. You will require funds in each of these cases once they are grown up (which we are here assuming here to be 20 years).
Now to attain your goals as we have learnt earlier, we need to estimate figures
Assuming we will require around 30,00,000 in todays value to achieve any of these goals after 20 years the same will cost us 8,751,139.10 owing to inflation of around 6.5%.
Now to achieve these goals you need to make a plan that how much you need to invest over a span of 20 years to generate equivalent or greater than the required amount. For which you may use our calculators such as
Investment planner calculators Sip calculator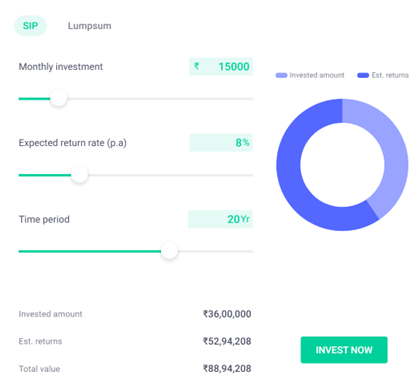
You can make a sip of as little as 15000 at very moderate return of just 8% over 20 years to generate such returns.
Now to really generate such returns you need to implement the plan; you need to find out which particular instrument can provide you returns you need with least downside risk.
After you have implemented the plan, you need to regularly evaluate your performance, for that you need to understand financial planning pyramid
Financial Planning Pyramid
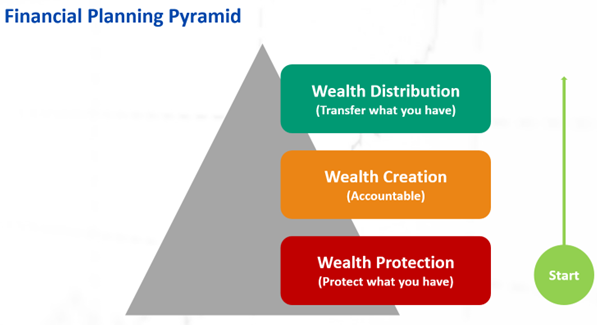
All of these elements are equally important.
Wealth Protection:Ideally, you should begin your financial planning with Protection Planning. You must first safeguard 'What you have.' It could be your life, health, property, vehicles, and so on. Plan for adequate insurance coverage and purchase the appropriate products to cover the risks associated with all of this. Another critical point is to 'establish and maintain an Emergency Fund.' This can range from 3 to 6 months of your monthly living expenses. However, do not invest this fund in high-risk investments. The main goal of keeping this fund is to have cash on hand in case of an emergency. Aside from these two points, you can focus on keeping a monthly budget. Keep track of your monthly cash inflows and outflows.
Wealth Creation: Most of us are more concerned with 'how to create wealth.' Without a doubt, this is an important aspect of your financial strategy. However, accumulating without a proper protection plan can be costly when faced with adversity. After you've created a good protection plan, you should create a list of realistic financial goals. Examples of accumulation goals include 'creating a corpus for retirement,' 'kids' education goals,' 'purchasing a property,' and so on. Choose appropriate investment products based on the timeframe of your objectives. For long-term goals, do not be afraid to invest in risky products such as mutual funds or stocks. Once you've allocated your savings to each goal, keep an eye on your portfolio. Change your asset allocation (debt vs equity) as needed.
Wealth Distribution: It is also referred to as Estate Planning. It is one of the most overlooked aspects of financial planning. Assume you have a good protection plan in place as well as good wealth accumulation strategies. But what is the point of constructing assets and purchasing insurance policies if you have not made proper nominations on your investments? If the head of the family dies without leaving a Will or without naming the nominees, the legal heirs face a difficult task in accessing the investments/assets. Estate planning is the process of making a plan ahead of time and naming who you want to inherit your possessions after you die.
Cash Flow Analysis (Current Status)

As simple as it sounds, you need to analyse your cash flow position; it can be on monthly basis, yearly basis or even quarterly basis. Monthly basis would be most suitable for you if you are an employed person, for traders like us quarterly basis could be perfect, and for business owner’s yearly basis can be suitable, again it is up to you to select but remember the rational should be recurring of your inflows or outflows.
For sake of easy understanding let’s say you are an employee of ZXY and apart from that you have an ancestral property In your home town, let’s see your cash flow position as follows
| Salary Income | 1,20,000/pm |
| Income from property | 25,000/pm |
You are a family of four and have a monthly cash outflow of 85,000/ pm.
| Grocery Bills | 10,000 |
| Medical Expenses | 7,000 |
| Fuel Bills | 8,000 |
| Education Expenses | 10,000 |
| Home Loan EMI | 35,000 |
| Other Expenses | 15,000 |
So you have a cash balance of 60000/pm isn’t it a healthy cashflow.
You need to consider your EMIs , bills and even taxes while calculating monthly cash outflows ;
And if you are doing this exercise consider only those payments or income which are recurring in nature, and always maintain a room for unexpected expenditures(as they too are recurring in nature but you almost never have any clue about them).
Current Asset Allocation
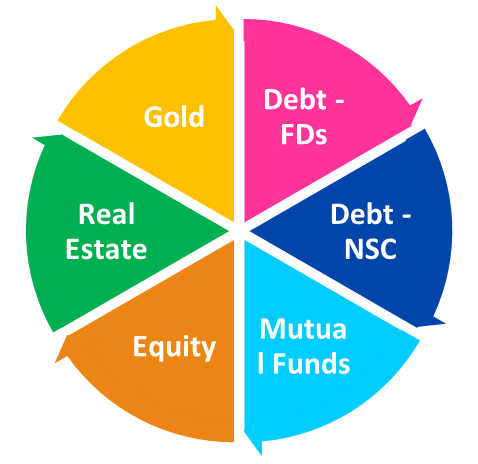
Asset allocation simply means how much you have allocated in any particular asset class. The pie chart above is just an illustration of asset allocation.
Consider anything to be an asset which provides a positive cashflow to you, liabilities on the opposite side is just opposite of an asset.
When you subtract all your liabilities from your asset you will get a figure which is your net worth.
Net Worth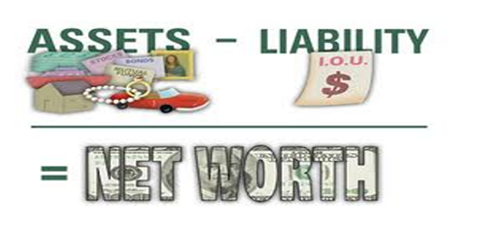
All liabilities are subtracted from assets to determine net worth. Liabilities are obligations such as loans and mortgages, whereas assets are anything owned that has monetary value.
Net worth can be positive or negative, with the former indicating that assets outnumber liabilities and the latter indicating that liabilities outnumber assets.
Good financial health is indicated by a rising net worth. Declining net worth, on the other hand, is cause for concern because it could indicate a drop in assets compared to liabilities.
On a personal note, while calculating net worth first consider all your assets and all your liabilities, that will be your real net worth, but you can move a step further by considering only liquid assets, in this way you will eliminate noise and will have an accurate perspective of what is your liquid net worth is.
WHY? : Because you might have a property but let’s say you can’t sell it so in reality it has no real value to you or you own gym equipment or mobile phone try not to consider them while calculating your net worth.
Risk profiling
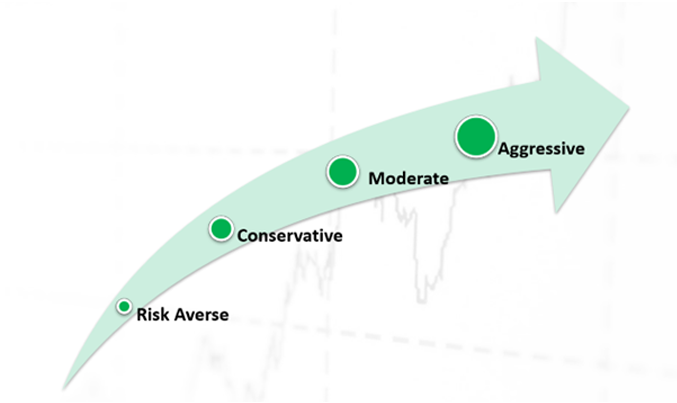
Risk profiling allows investors to assess themselves on various parameters in order to determine their risk-taking capacity and, as a result, allocate money to different asset classes.
Typically, risk profiling is carried out by a financial planner through a formal questionnaire-based process in which investors are asked questions about their risk-taking capacity and suitability. Age, dependents, financial commitments, investment horizon, liquidity requirements, loans/ liabilities, income stability, time horizon, and understanding of investments and financial markets are all important parameters to consider when determining an investor's risk profile , it allows investors to assess themselves on various parameters in order to determine their risk-taking capacity and, as a result, allocate money to different asset classes.
Typically, risk profiling is carried out by a financial planner through a formal questionnaire-based process in which investors are asked questions about their risk-taking capacity and suitability. Age, dependents, financial commitments, investment horizon, liquidity requirements, loans/ liabilities, income stability, time horizon, and understanding of investments and financial markets are all important parameters to consider when determining an investor's risk profile.
Your risk profile can be any among these: - • ConservativeA conservative risk profile denotes an aptitude that is significantly low in risk. Investors with this risk profile will prioritise investment options that provide corpus safety over all else. To conservative investors, the scale of returns is secondary as long as it is not negative. A conservative risk profile typically accounts for a short time horizon.
Treasury bills, corporate bonds, sovereign bonds, debt-based mutual funds, and other low-risk investment options are ideal for conservative or low-risk investors.
• ModerateModerate risk-takers typically strive for a balance of returns and risk. These individuals will seek high returns with a manageable level of risk. As a result, a moderate risktaker's portfolio will include a moderate proportion of equities as well as debt instruments for adequate risk dilution. Such risk-takers can also invest in equity-based mutual funds on their own.
• AggressiveThis risk-profile demonstrates the greatest willingness to withstand market volatility in the hope of earning exponential returns. Typically, these investors are experienced and well-versed in the ways of the stock market. Aside from that, such investors have a long-term investment horizon, which allows them to tolerate short-term volatility.
These investors prefer equities and typically have a healthy asset-liability balance; however, young people with sufficient disposable income may also fit this investment risk profile.
Emergency funds

So, for now you have assessed your risk profile, your cash flow and your financial goals but what if any uncertainty prevails what are you going to do at that time, will you break your fixed deposits or will you liquidate your investments, from personal experience liquidating your investments is excruciating.
And also, if you will keep liquidating your investments if any uncertainty prevails soon it is going to become a habit for you and that’s not good when you have an investment objective, so it is always better to be safe.
In order to avoid such consequences, we make emergency funds it can be used to deal with any emergency let be a medical emergency or you need to withdraw fund for you home renovation which wasn’t planned earlier. You need to consider that these kinds of expenses are always unexpected and can you would need to have a concrete cash balance to deal with them. For that you need to save aside a corpus every month and remember you can’t take huge risk with this amount.
You can keep 3-6 months as your emergency funds in cash or near cash investments like
- • Short Term Fixed Deposits
- • Sweep-in accounts
- • Short term Debt MF
As well as always have insurance.
Investment Planning for Goals
Goal based investing is most common when it comes to personal finance, and why it wouldn’t be why do we invest? to achieve some goals, let it be for a foreign trip, buying a car, higher education of your children or the biggest financial goal of all: financial freedom.
So, if we are setting a goal, we need a plan to achieve it and this is where certain things come to play like:
- • Net Present Value
- • Opportunity Cost
- • Future value of money
Let’s go one by one to understand each one of them
Opportunity Cost
Opportunity Cost simply means the cost you will incur if you will choose option A over option B.
For sake of understanding suppose you are travelling through the mountains and to reach a cliff you have two options to travel through car or to pick a bike.
If you pick a bike the pros will be that you will enjoy the surreal views of the valley but at the same time you have to bear the rough biking experience.
If you pick a car the pros will be the comfort but the experience won’t be the same, you won’t be able to click pictures at every spot where you want to as it will cause the traffic.
Here if you choose Bike the opportunity cost is comfort and if you have chosen car opportunity will be less pictures to post on Instagram.
In the same way when you invest the safety of funds is primary focus so if you are choosing equity to invest in the opportunity cost will be T-bills rate, as general public can’t directly invest into T-bills we consider the current inflation rate as the opportunity cost (as anyways if you are not going to invest you money will erode at this rate).
Opportunity cost = Risk free rate + Risk premium
Net Present Value
We all purchase assets in the hope that they will generate a reasonable return over time. For example, if I bought a plot of land today, I would expect it to be worth a certain amount in 15 years. The amount of money I will receive when I sell this piece of land in 15 years will be very different from the same amount today.
The concept of present value helps you understand the current value of funds you are likely to receive in the future.
Does that make sense? Most likely
Let us illustrate this with an example.
You buy a stock at 120 in 2008 and sold it for 960 in 2022, that translate into a 800% return over 14 years , but how much purchasing power does 960 have in todays value when compared to 120 in 2008.
This is a quite common question and all of you might have heard about it from you parents that they used to buy wheat for 2/kg and the minimum price for today is 24/kg if we are not considering any other things like quality what has caused the price of wheat to increase like this? It is opportunity cost for its producer or simply the inflation.
We use
Present value = Future value / (1+ discount rate ) ^ (time) to calculate the present value of money, if we put values into formula it would translate into =960/(1+6%)^14 =424.61 It means that 960 in 2022 will have same purchasing power as 424.61 in 2008. You can always use our calculators for the same.
Future Value of money:
If I will offer you to give you 1,00,000 today or 1,00,000 after 10 years what will you choose, obviously a wise man will choose the first option because money today is worth more than money tomorrow as it has an opportunity cost associated with it.
If we just reverse the formula for present value will get the formula for future value (it works on the principal of compound interest).
Now you need this things to consider before making any financial plan to achieve your goals , like I want to buy a Vacation home which cost me around 1,50,00,000 in today’s value home much it will cost me around 3,89,06,000 after 10 years owing to an opportunity cost of 10% .
So, in order to achieve it what do I need to invest 3,00,000 pm at around 13% p.a for 10 years or a lumpsum of 1,00,00,000 at 14.5 % for 10 years.
Doesn’t it sound crazy to invest such hefty amounts to buy an asset whose value is definitely going to appreciate after x years and if you have 1,00,00,000 to invest why don’t you buy land directly or have a debt mix with it.
Well these are your home work activity and it will help you to make better financial decision.
Insurance
Insurance is definitely a must have for you as you never know what could happen next, we will to understand very basics of insurance here, Broadly, there are 2ctypes of insurance, namely:

- • Life Insurance
- • General insurance
1. Life Insurance

Life insurance is a policy or cover that allows the policyholder to provide financial security to his or her family after death. Assume you are the family's sole breadwinner, supporting your spouse and children.
Your death would financially devastate your entire family in such a scenario. Life insurance policies prevent this from happening by providing financial support to your family in the event of your death.
The Different Types of Life Insurance Policies
When it comes to life insurance, there are primarily seven different types of policies. These are the following:
Term Plan - A term plan's death benefit is only available for a set amount of time, such as 40 years from the date of purchase.
Endowment Plan - An endowment plan is a type of life insurance policy in which a portion of your premiums is used to pay the death benefit and the rest is invested by the insurance company. Endowment policies provide assistance in the form of maturity benefits, death benefits, and periodic bonuses.
Unit Linked Insurance Plans, or ULIPs, are similar to endowment plans in that a portion of your insurance premiums is invested in mutual funds and the rest is used to pay out a death benefit.
Whole Life Insurance - As the name implies, these policies provide coverage for an individual's entire life, rather than just a set period of time. Some insurers may limit the duration of whole life insurance to 100 years.
Child's Plan - A life insurance policy with an investment component that provides financial assistance to your children throughout their lives. After the death of both parents, the death benefit is available as a lump-sum payment.
Money-Back - These policies pay out a set percentage of the plan's sum assured at predetermined intervals. This is referred to as a survival benefit.
Retirement plans, also known as pension plans, are a hybrid of investment and insurance policies. A portion of the premiums is used to build the policyholder's retirement fund. After the policyholder retires, this is available as a lump-sum or monthly payment.
Life Insurance BenefitsIf you have a life insurance policy, you can take advantage of the following benefits.
Tax Benefits - In India, you are eligible for tax benefits if you pay life insurance premiums under Sections 80(C) and 10(10D) of the Income Tax Act. By purchasing a life insurance policy, you can save a significant amount of money in taxes.
Encourages the habit of saving - Because you must pay policy premiums, purchasing such an insurance policy encourages you to save money.
Ensures Financial Independence for Your Family - The policy ensures your family's financial independence even after your death.
Assists in Retirement Planning - Some life insurance policies can also be used as investment vehicles. Pension plans, for example, provide a lump-sum payout when you retire, which can help you fund your retirement.
Now that you've learned everything there is to know about life insurance policies, keep reading to learn about the various aspects of other types of general insurance policies.
General insurance
Almost nothing can be insured. In India, however, general insurance is divided into four categories: fire, engineering, marine, and miscellaneous.

Let's take a look at them in terms of their utility and general acceptability. The following are the various types of general insurance available in India:
- • Health Insurance
- • Travel Insurance
- • Motor Insurance
- • Marine Insurance
- • Home Insurance
- • Commercial Insurance
Motor insurance refers to policies that provide financial assistance in the event that your car or motorcycle is involved in an accident. There are three types of motor vehicles for which insurance is available:
Car Insurance - This type of policy covers privately owned four-wheeler vehicles.
Two-wheeler Insurance - These plans cover personally owned two-wheeler vehicles, such as bikes and scooters.
Commercial Vehicle Insurance - If you own a vehicle that is used for business purposes, you must insure it. These policies ensure that your company's vehicles are kept in top condition, reducing losses significantly.
The Different Types of Automobile Insurance PoliciesMotor insurance policies are classified into three categories based on the amount of coverage or protection they provide:
Third-Party Liability - In India, this is the most basic form of motor insurance. According to the Motor Vehicles Act of 1988, it is the bare minimum requirement for all motor vehicle owners. Premiums for such policies are typically low due to the limited financial assistance. These insurance plans only cover the financial liability of the third-party involved in the accident, ensuring that you are not subjected to legal action as a result of the mishap. They do not, however, provide any financial assistance for the policyholder's vehicle to be repaired after an accident.
Comprehensive Coverage - Comprehensive insurance plans provide more protection and security than third-party liability plans. Apart from third-party liabilities, these plans also cover the costs of repairing the policyholder's own vehicle if it is damaged in an accident. Furthermore, comprehensive plans pay out if your vehicle is damaged due to fire, man-made and natural disasters, riots, and other similar events. Finally, if you have comprehensive coverage, you can recover the cost of your bike if it is stolen. With a comprehensive motor insurance policy, one can choose from a variety of add-ons to make it more complete. Zero depreciation coverage, engine and gearbox protection, consumable coverage, breakdown assistance, and other options are available.
Own Damage Coverage - This is a type of specialised motor insurance that insurance companies offer to customers. Furthermore, you can only get such a plan if you bought your two-wheeler or car after September 2018. It must be a brand new vehicle, not a repossessed vehicle. You should also keep in mind that you can only get this standalone own damage coverage if you already have a third-party liability policy. Own damage cover provides you with the same benefits as a comprehensive policy but without the third-party liability coverage.
Advantages of Automobile Insurance PoliciesAutomobiles and motorcycles are becoming more and more expensive with each passing day. Staying without proper insurance at this time can result in significant financial losses for the owner. Some of the benefits of purchasing such a plan are listed below.
Avoids Legal Trouble - Assists you in avoiding any traffic fines or other legal issues that you would otherwise have to deal with.
Financial Support for Repair Your Own Vehicle - After an accident, you will have to spend a significant amount of money to repair your own vehicle. Insurance policies limit such out-of-pocket costs, allowing you to get repairs done right away.
If your car or motorcycle is stolen, your insurance policy will help you reclaim a portion of the vehicle's on-road cost. If your vehicle is damaged beyond repair due to an accident, you can expect similar assistance.
Individuals who own a commercial vehicle or two-wheeler can also benefit from tax benefits if they pay premiums for that vehicle.
Health InsuranceHealth insurance is a type of general insurance that assists policyholders financially when they are admitted to hospitals for treatment. Some plans also cover the cost of treatment received at home prior to a hospitalisation or following discharge from one.
Health insurance has become a necessity in India due to rising medical inflation. Consider the various types of health insurance plans available in India before proceeding with your purchase.
Health Insurance Policies Types In India, there are eight different types of health insurance policies. They are as follows:
Individual Health Insurance (IHI) is a type of health insurance that covers only one policyholder.
Family Floater Insurance - These policies allow you to insure your entire family without having to purchase individual plans for each member. Under one such family floater policy, a husband, wife, and two of their children are usually covered.
Critical Illness Coverage - These are specialised health plans that offer substantial financial assistance to policyholders who have been diagnosed with certain chronic illnesses. Unlike traditional health insurance policies, these plans pay out a lump sum after a diagnosis.
Senior Citizen Health Insurance - As the name implies, these policies are designed for people over the age of 60.
Group health insurance is a type of policy that is typically offered to employees of a company or organisation. They are designed so that older beneficiaries can be removed and new beneficiaries can be added depending on the company's ability to retain employees.
Prenatal, postnatal, and delivery medical expenses are covered by maternity health insurance policies. It protects both the mother and her child.
Personal Accident Insurance - These medical insurance policies only cover financial liability for accidents that result in injuries, disability, or death.
Preventive Healthcare Plan - These policies pay for treatment that is aimed at preventing a serious disease or condition.
Health Insurance BenefitsAfter reviewing the various types of health insurance available, you may be wondering why getting one is so important for you and your family. Take a look at the list of reasons below to see why.
Medical Coverage - The main advantage of this type of insurance is that it provides financial protection against medical expenses.
Cashless Claim - If you seek treatment at one of the hospitals with which your insurance provider has a tie-up, you may be eligible for a cashless claim. This feature ensures that your insurer and hospital settle all medical bills directly.
Tax Advantages - Those who pay health insurance premiums may be eligible for income tax advantages. A tax benefit of up to Rs.1 lakh is available under Section 80D of the Income Tax Act on premium payments for health insurance policies.
Travel InsuranceWhen discussing the various types of insurance policies, it is important to remember to learn more about travel insurance plans. Such policies ensure a traveller's financial security while on the road. As a result, compared to other insurance policies, travel insurance is a temporary solution.
Travel insurance may provide financial assistance in a variety of situations, including baggage loss, trip cancellation, and more, depending on the provider you choose. Here are some of the various types of travel insurance policies available in the country:
Domestic Travel Insurance is a type of travel insurance that protects your finances while travelling within India. However, if you intend to travel outside of the country for a vacation, such a policy will be useless.
International Travel Insurance - If you're planning on leaving the country, make sure you get international travel insurance. It enables you to cover unexpected costs that may arise during your trip, such as medical emergencies, baggage loss, passport loss, and so on.
for Your Home Holiday Insurance - When you travel with your family, your home is left unguarded and unprotected. Burglary is always a possibility, and it can result in significant losses.
The Advantages of Travel InsuranceTravel insurance policies cover the following aspects:
Cover Flight Delay - Passengers can lose a lot of money if their flight is delayed or cancelled. If you purchase travel insurance, you can file a claim with the insurer for such financial losses.
Baggage Loss/Delay - Travel insurance allows you to seek monetary compensation if your luggage is lost or delayed during your trip. You can buy some of the necessary items with this amount.
Recover Lost Travel Documents - When travelling internationally, a visa and passport are required documents. When you purchase international travel insurance, you ensure that you have the financial means to reapply for interim or replacement documents as needed.
Trip Cancellation Insurance - A sudden death in the family or a medical emergency can throw your travel plans into disarray. Fortunately, international travel insurance policies cover trip cancellations in such circumstances. You may be eligible for financial assistance to cover penalties and cancellation fees for flights, hotels, and other travel arrangements.
Make sure you choose an insurer carefully, especially one that is dependable and available to help you 24 hours a day, seven days a week.
Property InsuranceProperty insurance policies can cover any building or immovable structure. This could be your home or a business location. If such a property is damaged, you can seek financial assistance from the insurance company. Keep in mind that such a plan also protects the property's contents financially.
In India, there are various types of property insurance.
In India, there are several different types of property insurance policies:
Home Insurance - With this type of policy, you are protected against any financial obligations that may arise as a result of damage to your home or its contents caused by fires, burglaries, storms, earthquakes, explosions, and other events.
Shop Insurance - If you own a shop that provides you with a source of income, it is critical that you protect yourself from financial liability associated with it. Whether the liability arises as a result of natural disasters or accidents, these plans allow you to immediately repair the shop.
Office Insurance - Office insurance is a type of property insurance policy that ensures that the office building and all of the equipment inside are adequately protected in the event of unforeseen events. In most cases, office spaces contain expensive equipment such as computers, servers, and other similar items. As a result, it is critical to take advantage of these plans.
Building Insurance - If you own an entire structure, home insurance may not be enough. Alternatively, you can buy building insurance to cover the entire property.
Property Insurance's AdvantagesTake a look at some of the benefits of property insurance if you still don't think it's one of the types of insurance you should get.
Protection from Fires - While an insurance policy cannot prevent fires, it can protect you financially in the event of one.
Burglaries - If your property is located in an area where theft and burglaries are common, such a policy is essential to protect your finances.
Floods - Floods are common in some parts of India. These floods can wreak havoc on your property, resulting in significant losses. Such events are also covered by property insurance.
Natural Disasters - The plan also provides financial assistance in the event of damage caused by natural disasters such as earthquakes, storms, and other natural disasters.
A property's reconstruction or renovation is extremely costly. As a result, property insurance policies are the best bet for long-term financial security.
The Fundamentals of Income Tax Structure in India
If you're employed (or even self-employed), you probably pay your taxes on time every year when tax season arrives. Perhaps you have a friend who is knowledgeable about taxation and finance and does your tax filing for you. Or perhaps you know someone who works in taxation and they take care of your taxes as a courtesy.
But, honestly, how much do you know about the taxes you pay? Have you ever wondered why you pay the taxes that you do? Or if there is any legal way to reduce that liability? If you have, the best way to resolve your concerns is to learn about the Indian tax system. Taxation in India is intricate and complex, particularly with regard to income tax.
However, knowing every aspect of India's taxation system is not necessary for the layperson. Sure, that can be a plus. To begin, it's a good idea to learn about how your personal income is taxed. And how you can plan your investments and finances so that you can fully benefit from the tax breaks built into the Indian tax system. The Income Tax Act of India governs the tax system, which is divided into 23 chapters and 298 sections.
Let's go over the fundamentals of the rules, regulations, and structure of India's taxation system in terms of personal income tax.
Previous year and assessment year conceptsThis is one of the most fundamental topics we'll cover before diving into how taxes are calculated. In India, taxes are levied on income earned over a 12-month period – from April 1 of any year to March 31 of the following year. This is referred to as the previous year or the fiscal year. Consider the income you earned between April 1, 2019 and March 31, 2020. This is your earnings for the fiscal year 2019-20.
The assessment year is the year that follows the previous year. It is the year in which the previous year's income is assessed. As a result, in the preceding example, the assessment year will run from April 1, 2020 to March 31, 2021. In other words, the assessment period will run from 2020 to 21.
In India, who is required to pay income tax?Income tax is a liability that is shared by all types of organisations. Individuals, HUFs, partnership firms, and corporations must all pay this tax. In this chapter, we'll look specifically at how individuals like you are taxed under India's taxation system.
In our country, your residential status has a significant impact on your tax liability. You are classified as one of the following based on the conditions you meet.
- 1. Ordinarily Resident and Resident (ROR)
- 2. Resident and Non-Official Resident (RNOR)
- 3. Non-resident
All of these groups are required to pay taxes on their income earned in India. If you've been living and working in India for several years, you're almost certainly a resident. We'll assume you're a resident Indian and investigate how taxes are calculated for residents.
The five sources of incomeEvery resident Indian is required to pay income taxes. You could be a retiree living off interest income. You could be a salaried worker. You could also have won the lottery. In the Indian tax system, all of these earnings are taxable. There are five different types of income.
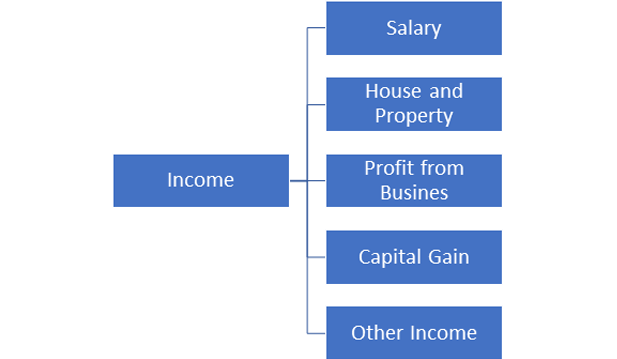
- 1. Salary Income
- 2. Income from house and property
- 3. Gains and profits from a business or profession
- 4. Capital Gain.
- 5. Other sources of income
This category of income includes all earnings you receive as part of your salary. This category includes your basic salary, gratuity, pension, annuity, commission, fees, leave encashment, and profits from your employer. It also includes any allowances you receive. Some allowances, however, are partially or completely tax-free.
House property incomeAs the name implies, this income category includes earnings from any house property you own. Rental income, for example, is classified under this category.
Gains and profits from a business or professionThis is the third type of income, and it includes profits and gains from a person's business or profession. Under this heading, the profit (the difference between expenses and income earned) is chargeable.
Capital GainProfits from the sale or transfer of capital assets held in your name are taxed as capital gains. Gains from investments in real estate, stocks, mutual funds, and other capital assets, for example, are considered capital gains. They can be either long-term or short-term capital gains, and they are taxed accordingly.
Other sources of incomeIncome from other sources is defined as any type of income that does not fall into one of the above-mentioned categories. Winnings from horse racing or the lottery, dividend income, and interest from government bonds and securities are some examples.
Total earningsThe total income for the previous year is calculated by adding the income from the five categories listed above.
Deductions from total earningsBefore you can calculate your tax on your total income, you can deduct certain amounts from it. These deductions are numerous and diverse. Individual taxpayers, on the other hand, are most interested in the deductions mentioned in section 80C of the Act.
The following items are allowed as a deduction under section 80C.
- o Investment in Public Provident Fund (PPF)
- o Investment in Employee Provident Fund (EPF)
- o Investment in National Saving Certificate (NSC)
- o Investment in Sukanya Samriddhi Yojana (SSY)
- o Investment in 5-year Tax Saving Fixed Deposit
- o Investment in Senior Citizens Savings Scheme (SCSS)
- o Investment in life insurance
- o Investment in infrastructure bonds
- o Investment in Unit Linked Insurance Plans (ULIPs)
- o Investment in Equity Linked Saving Scheme (ELSS)
- o Investment in National Pension System (NPS)
- o Repayment of the principal of a housing loan
- o Payment of tuition fees for children
Many other deductions are also available under other subsections of section 80. Some examples are:
- • Section 80TTA deductions for savings account interest
- • Deductions for paid house rent under Section 80GG
- • Section 80E deductions for education loan interest
- • Deductions for home loan interest under Section 80EE
- • Section 80D deductions for medical insurance premiums paid
- • Deductions for specific donations under Section 80G
After deducting all eligible amounts from total income, you are left with total taxable income. You must then determine which tax bracket it belongs to and calculate the tax accordingly.
Using tax slabs to calculate income taxWhen the budget for the following year is announced, the income tax slabs are frequently revised. Assessees currently have the option of using the old scheme or the new scheme for the fiscal year 2020-21. The rates under these two schemes for resident Indians under the age of 60 are shown below.
| Taxable income | Tax Rate (Existing Scheme) | Tax Rate (New Scheme) |
|---|---|---|
| Up to Rs. 2,50,000 | Nil | Nil |
| Rs. 2,50,001 to Rs. 5,00,000 | 5% | 5% |
| Rs. 5,00,001 to Rs. 7,50,000 | 20% | 10% |
| Rs. 7,50,001 to Rs. 10,00,000 | 20% | 15% |
| Rs. 10,00,001 to Rs. 12,50,000 | 30% | 20% |
| Rs. 12,50,001 to Rs. 15,00,000 | 30% | 25% |
| Above Rs. 15,00,000 | 30% | 30% |
Individuals who are senior citizens, between the ages of 60 and 80 must apply the rates given below.
| Taxable income | Tax Rate (Existing Scheme) | Tax Rate (New Scheme) |
|---|---|---|
| Up to Rs. 2,50,000 | Nil | Nil |
| Rs. 2,50,001 to Rs. 3,00,000 | Nill | 5% |
| Rs. 3,00,001 to Rs. 5,00,000 | 5% | 5% |
| Rs. 3,00,001 to Rs. 7,50,000 | 20% | 10% |
| Rs. 07,50,001 to Rs. 10,00,000 | 20% | 15% |
| Rs. 10,00,001 to Rs. 12,50,000 | 30% | 20% |
| Rs. 12,50,001 to Rs. 15,00,000 | 30% | 25% |
| Above Rs. 15,00,000 | 30% | 30% |
Super senior citizens, who are over the age of 80, have more relaxations. The rates below will show you that.
| Taxable income | Tax Rate (Existing Scheme) | Tax Rate (New Scheme) |
|---|---|---|
| Up to Rs. 2,50,000 | Nil | Nil |
| Rs. 2,50,001 to Rs. 5,00,000 | Nill | 5% |
| Rs. 5,00,001 to Rs. 7,50,000 | 20% | 10% |
| Rs. 7,50,001 to Rs. 10,00,000 | 20% | 15% |
| Rs. 10,00,001 to Rs. 12,50,000 | 30% | 20% |
| Rs. 12,50,001 to Rs. 15,00,000 | 30% | 25% |
| Above Rs. 15,00,000 | 30% | 30% |
What are futures?
A futures contract is a legal agreement to acquire or sell a specific commodity asset or security at a defined price at a future date. To simplify trading on a futures exchange, futures contracts are standardised for quality and quantity. When a futures contract is purchased, the buyer assumes the responsibility to purchase and receive the underlying asset when the contract expires. The seller of the futures contract agrees to furnish and deliver the underlying asset by the expiration date.
Futures are exchanged on regulated exchanges with a defined physical location where trading takes place, as opposed to forward contracts, which are transacted in an over-the-counter market. This creates a ready, liquid market in which futures can be purchased and traded at any moment, just like stocks.
Standardisation: In the case of forward currency contracts, the quantity of product to be supplied and the maturity date are negotiated between the buyer and seller and can be tailored to the customer's specifications. Both of these are specified in a futures contract by the exchange on which the contract is traded.
Marking to Market: The exchange employs a marking to market mechanism in which all existing contracts are replayed at the settlement price of that trading session at the end of each trading session. This means that some participants will lose money while others will profit. The exchange corrects this by debiting the margin accounts of those members who lost and crediting the accounts of those who won.
Actual Delivery is uncommon: The commodity is typically provided by the seller and accepted by the buyer in most forward contracts. Forward contracts are used to acquire or dispose of a commodity in the future for a profit at a known price today.
Clearing House: The exchange serves as a clearing house for all contracts entered into on the trading floor. For example, suppose A and B reach an agreement. This is immediately replaced in the exchange records by two contracts, one between A and the clearing house and another between B and the clearing house.
Margins: The exchange, like all exchanges, allows only members to deal in futures contracts. Others can employ the members' services as brokers to use this instrument. As a result, an exchange member can trade both on his own account and on behalf of a client. The "clearing members," or members of the clearing house, are a subset of the members, and non-clearing members must clear all transactions through a clearing member.
Important Futures Contract Terminology
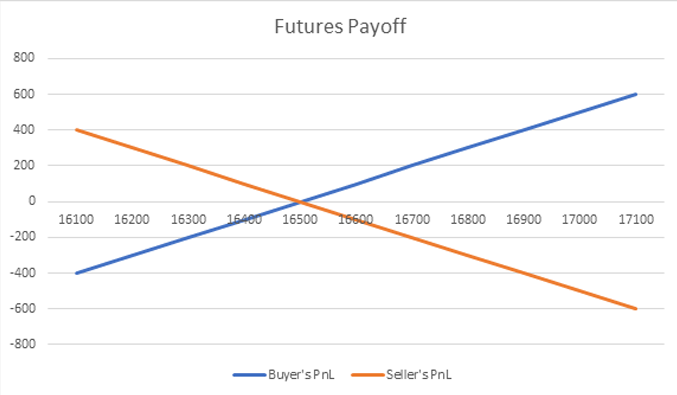
Spot Price - The current market price at which an asset is bought or sold for immediate payment and delivery is known as the spot price. The spot price is significant because it represents the price at which buyers and sellers agree to value an asset.
Future Price - The agreed-upon price for the delivery of an asset at a specific future date at the time of the contract. The price of a futures contract is generally higher than the price of the underlying asset (in our case, stocks).
Lot Size - Buying milk at the market is comparable to lot size. Standard lots exist. Milk is available in 250 ml, 500 ml, and 1 litre sizes. You cannot request half a glass of milk from the shopkeeper! Lot sizes are also used in futures contracts. For instance, the lot size for the Nifty is 50 shares.
Contract value is the actual monetary value of your position. It is calculated by multiplying the lot size by the futures contract price. 1 Britannia futures contract is worth Rs 700,000 (Rs 3500*200).
Contract Cycle - The period during which a contract trades on the Friday following the previous Thursday, when a new contract with a three-month expiry is introduced for trading.
Expiry Date - Every futures contract has an expiry date. On the last Thursday of each month, all futures contracts expire. If the last Thursday of the month is a holiday, the contract will expire on Wednesday.
There are three futures contracts available for trading at any given time. In the image below -
- • Futures contract that will expire in the current month
- • Contracts expiring in the next month
- • Futures contract expiring in the following month-Far Month
Index Futures and Stock Futures
The Nifty Futures has a very special place in the Indian derivatives world. The 'Nifty Futures' contract is the most liquid in the Indian derivative markets because it is the most widely traded futures instrument. Indeed, you might be surprised to learn that Nifty Futures is easily one of the top ten index futures contracts traded globally. Once you're comfortable with futures trading, I'm sure you'll be actively trading the Nifty Futures like many of us. As a result, it makes sense to thoroughly understand Nifty futures. However, before we go any further, I'd like to refresh your memory on the Index, which we discussed here.
Assuming you have a basic understanding of the index, I will move on to discuss Index Futures or Nifty Futures.
As we all know, a futures contract is a derivative contract that derives its value from an underlying asset. In the case of Nifty futures, the underlying is the Index itself. As a result, the Nifty Futures are based on the Nifty Index. This means that if the Nifty Index rises in value, so will the Nifty futures. Similarly, if the Nifty Index falls in value, so will the Index futures.
Stock futures are contracts to buy or sell a stock at a specific price on a specific date in the future. Options should not be confused with stock futures. Buyers and sellers of stock futures must enter into an agreement with fixed prices and expiration dates.
Futures Payoffs
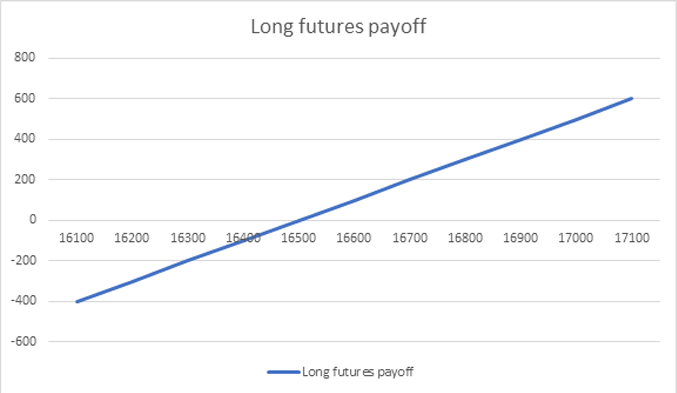
Futures contracts have symmetrical or linear payoffs. It implies that the buyer's and seller's losses and profits on a futures contract are both unlimited.
Assume you bought Nifty Futures at 16500; your pay off will be as follows
| Nifty | Buying price | PnL |
|---|---|---|
| 16100 | 16500 | -400 |
| 16200 | 16500 | -300 |
| 16300 | 16500 | -200 |
| 16400 | 16500 | -100 |
| 16500 | 16500 | 0 |
| 16600 | 16500 | 100 |
| 16700 | 16500 | 200 |
| 16800 | 16500 | 300 |
| 16900 | 16500 | 400 |
| 17000 | 16500 | 500 |
| 17100 | 16500 | 600 |
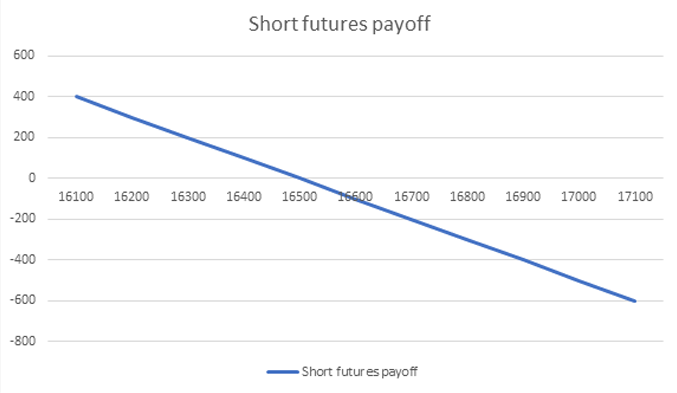
It is a zero sum game, which means that the buyers profit will always be equal to the seller’s loss, or seller’s profit will be equal to the buyer’s profit, so if you sold Nifty at 16500 your mark to market profit/loss would be similar to the graph shown above.
Margins

Margins are clearly important in futures trading because they allow for leverage. In fact, margins are what give a 'Futures Agreement' the necessary financial twist (as compared to the spot market transaction). As a result, understanding margins and the various aspects of margins is critical.
Margin is the money you need to initiate a position in futures. It is required to eliminate counter party default risk.
It is an aggregate of two things SPAN margin and Exposure margin.
What exactly is SPAN margin?
SPAN, or Standard Portfolio Analysis of Risk, is a technique used to measure portfolio risk that gets its name from the software programme that calculates it. The SPAN margin, also known as a VaR margin in Indian stock markets, is the minimum margin required to initiate a trade in the market. It is calculated using a standardised form of risk portfolio analysis for F&O strategies. Before placing an order, one can calculate their margin from multiple positions using certain tools. The SPAN margin is typically used by F&O traders who already have enough cover from their positions to cover any potential losses.
According to how the SPAN margin works, the margin is set via the system for each position in a portfolio to account for the possibility of the worst intraday movement. This is accomplished by calculating a variety of risk factors to determine the potential gains and losses for a contract under various conditions. Volatility, price changes, and a shortened deadline are among the conditions mentioned above.
SPAN margins differ from security to security depending on the type of risk that must be assumed in conjunction with the security. The SPAN margin requirement for a single stock, for example, will be higher than the requirement for an Index. This is because the risk in a single stock is greater than the risk in an index. Furthermore, as a general rule, the lower the volatility, the lower the SPAN requirement, and the higher the volatility, the higher the SPAN requirement.
What exactly is exposure margin?
The exposure margin is charged in addition to the SPAN margin and is usually done at the broker's discretion. It is also known as additional margin and is collected to protect a broker from liability that may arise as a result of erratic market swings. The SPAN margin is an initial calculation derived from assessing the risk and volatility factors, according to one perspective. The exposure margin, on the other hand, is comparable to an add-on margin value that is dependent on the level of exposure.
When calculating exposure margins, the underlying rule is that the margin for index futures contracts is limited to 3% of the contract's total value. For example, if a Nifty future contract is worth Rs 10 lakh, the exposure margin is 3% of the value, or Rs 30,000.
When starting a futures trade, the investor must adhere to the initial margin. Simply put, this is what is obtained when the SPAN and exposure margins are combined. Once confirmed, the exchanges block the entire margin. According to new guidelines implemented in 2018, each margin for an overnight position must be blocked. Failure to comply with this results in a penalty.
MARGIN CALCULATOR
Long and short futures
Short futures mean you have sold futures and expecting market to move down; Long futures means that you have bought futures and expecting prices to move higher. Closing or squaring off a short position is called short covering where as closing or squaring off a long position is called long unwinding.
Long Futures and payoff
In long futures you make money when underlying moves upwards and lose in equal quantum when it moves downwards.
We take a long position when we are bullish on index or the stock.
To create a long position, you simply need to buy a lot (or as much as you like) to create a long position. When we are saying we are long TCS it means that we have a net buy position in TCS and while we are talking about futures it would be simply buying Futures, and in general you can also buy from cash market, buy call options and sell put options to create a simple long position.
Short Futures and payoff
In short futures you make money when underlying moves downwards and lose in equal quantum when it moves upwards.
We take a short position when we are bearish on index or the stock.
To create a short position, you simply need to buy a lot (or as much as you like) to create a short position. When we are saying we are Short ITC it means that we have a net sell position in ITC and while we are talking about futures it would be simply selling Futures, and in general you can also sell in cash market, buy put options and sell call options to create a simple short position.
Rollover
Rollover is the process of switching from a front-month contract that is about to expire to another contract in a later month, i.e. carrying forward your futures positions. This entails closing your position in the contract that is about to expire and opening a similar new position in a contract that is further out in time.
Any futures or options you purchase will have an expiry date (last day until which you can trade that contract). So, for example, you can only trade the Nifty 24th February future until the 24th February 2022. What if you want to hold a nifty futures contract until March?
In this case, you must exit the Nifty February futures contract and open a new position in the March futures contract, which will be valid until March 31th, 2011. Rolling over refers to the process of moving your position from one month to the next. This rolling over can be done at any time before the market closes on February 24th, 2022.
So, for example, if you purchased a Nifty February future at 11050 and the Nifty future is 11000 on February 20th, you may decide to roll over your position to March in order to continue your nifty future buy position. So, basically, you will sell the Nifty February futures contract and buy the Nifty March futures contract, which you can now hold until March 31th.
Note that when you sell the February futures, you must pay brokerage and charges, and when you buy back the March futures, you must pay brokerage and charges once more. Charges are comparable to those associated with a standard buy and sell transaction.
Hedging
Hedging is one of the most important and practical applications of Futures. Hedging is a simple way to protect your trading positions from losses in the event of adverse market movements.
Hedging can be accomplished through the use of various derivatives. The first method is to hedge with futures contracts. Futures can be used by both producers and end users to hedge against price fluctuations. They mitigate their price risk by purchasing a futures contract on a futures exchange, securing a pre-determined price for their product.
The basis(future premium) is an important factor in determining the final price. The basis(future premium) is determined by subtracting the futures price from the spot price. The eventual price of a commodity can be calculated at the time the hedge is placed by successfully predicting its basis. Futures can be used to hedge in two ways: long hedging and short hedging.
We'll start with hedging a single stock futures contract because it's the simplest and most straightforward to implement. We will also understand its limitations before moving on to learn how to hedge a stock portfolio.
Assume you purchased 250 shares of Reliance at Rs.2,584/- per share. This equates to a Rs.646,000/- investment. You are clearly 'Long' on Reliance in the spot market. You realise the quarterly results are due soon after you open this position. You are concerned that Reliance will release unfavourable financial results, causing the stock price to plummet significantly. You decide to hedge the position to avoid a loss in the spot market.
To hedge the spot position, we simply enter a counter position in the futures market. Because we are 'long' in the spot market, we must 'short' in the futures market.
Here are the specifics of the short futures trade –
Futures Contracts @ 2585/-
The lot size is 250.
Rs.646,250/- is the contract value.
On the one hand, you are long Reliance (in the spot market), while we are short Reliance (in the futures market), albeit at different prices. However, the price variation is unimportant because we are 'neutral' in terms of direction. You will quickly realise what this means.
After starting this trade, let us arbitrarily imagine different price points for Infosys and see how they affect the positions.
| Arbitrary Price | Long Spot P&L | Short Futures P&L | Net P&L |
|---|---|---|---|
| 2500 | 2500 – 2584 = – 84 | 2585 – 2500 = +85 | -84 + 85 = +1 |
| 2590 | 2590 – 2284 = +6 | 2585 – 2590 = -5 | 2585 – 2500 = +85 |
| 2700 | 2700 – 2584 = +116 | 2585 – 2700 = -115 | +116 – 115 = +1 |
The key point to remember here is that regardless of where the price is headed (up or down), the position will neither make nor lose money. The overall position appears to be frozen. Indeed, the position becomes apathetic to the market, which is why we say that when a position is hedged, it remains 'neutral' to the overall market condition. As I previously stated, hedging single stock positions is simple and straightforward. To hedge the position, we can use the stock's futures contract.
Physical Settlement

If you hold a position in any Stock F&O contract, you will be required to give/take delivery of stocks when it expires. Physical settlement is only available for stock derivatives. Index options do not have to be physically settled. Index contracts are only settled in cash.
To avoid the complexities of physical settlement, it is strongly advised that a trader square off all positions before expiry.
SEBI introduced the concept of physical settlement in equity derivatives in July 2018 and made it mandatory for all stocks beginning with the October 2019 expiry date.
Because Indian derivatives markets are among the most speculative in the world, F&O physical settlement was implemented. Excessive speculation causes excessive market volatility. To reduce excessive speculation, SEBI devised the concept of physical stock settlement, as is done in the equity segment.
The introduction of physical settlement of stock derivatives has had the following effects on derivatives investors:
- • Demat account maintenance is required for derivatives trading.
- • Increased fund requirements to meet fund obligations and delivery margins.
- • The stock arrangement must be completed in the case of a stock delivery position.
- • In the event of non-compliance, a severe penalty may be imposed.
Settlement Obligation Calculation
- • On the following positions, the obligation is calculated after the close of trading on the expiry day:
- • All futures positions are open.
- • All contracts that are in-the-money (ITM) and have been exercised and assigned.
The obligation resulting from the above scenarios will result in either receiving or delivering the security as follows:
| Scenarios which will result in receipt of security | Scenarios which will result in the delivery of security |
|---|---|
| Open long futures position | Open short futures position |
| Long call exercised | Short call assigned |
| Short put assigned | Long put exercised |
Because the F&O deals in lot sizes, the quantity to be received or delivered is calculated as Market Lot Size * Contract Number.
If you want to avoid physical settlement and have an open position in futures or options stock, you can roll over, square off, or exit the position of the expiring month contract on or before expiry so that there is no open position for physical settlement.
Another new facility provided by the exchange for the physical settlement of options is the 'Do-not-exercise' option via the clearing member for Close to money (CTM) strike prices. CTM strike prices are the most similar to the settlement price.
The exchange has established the following criteria for determining CTM strike prices:
The first three ITM options strikes that are immediately below the final settlement price are considered CTM for call options, and the first three ITM options strikes that are immediately above the final settlement price are considered CTM for put options.
On the expiry day, the exchange sends trading members a file containing CTM contract details, which must be returned to the exchange with a message indicating whether you want to exercise or not.
If the Do-not-exercise option is selected, the ITM contract will not be counted for physical settlement and will be cash-settled. However, if no response is provided, such contracts will automatically result in physical settlement.
As a result of the preceding process, the securities/stock obligation is derived. Along with stock, the fund obligation must be met. Let us look at how the fund obligation is calculated.
In the case of physical futures settlement, the settlement price would be the futures final settlement price, which is the closing price of the underlying stock in the capital market segment on the expiry day. [Lot size* Contract count* Closing price of the underlying security in the capital market segment]
In the case of options, the settlement obligation is calculated at the strike price of the option contract. [Lot size* Contract count* Strike price]
It should be noted that the above obligation is in addition to the normal final settlement, which would be cash-settled along with MTM on T+1.
Physical Settlement Delivery MarginThe stocks identified for physical settlement would be eligible for the delivery margin, as is currently done in the Capital market segment. These margins will be collected in addition to the initial margin by the clearing member.
In the case of long options (put and call), the delivery margin is levied four days before the expiry day, on the Friday preceding the expiry week.
Once the physical settlement process is completed, the delivery margin will be released.
There will be no assignment margins for the assigned option stocks that have been identified for physical settlement.
Physical Settlement TimelinesPhysical settlement occurs on Expiry + 2 days.
If your securities obligation is at the receiving end, you will receive stock for which you must arrange funds to pay to the exchange.
If your securities obligation is in the delivery position, you must arrange for stock in your demat account for pay-in in order to receive funds from the exchange. Because all of the above exchange settlement occurs through the clearing member, the funds and securities must be made available to the clearing member well before the below cut off times specified by the exchange in order to meet the obligation.
Securities paymentSecurities must be available to clearing members by 2 p.m. IST.
Deposit of fundsBy 2.00 p.m. IST, funds should be transferred to the clearing member.
The exchange also offers an early pay-in option, allowing funds/security obligations to be fulfilled on Expiry +1 day.
The advantage of using the early pay-in facility is that it provides early relief from the delivery margin.
Failure to meet the physical settlement obligationIf a clearing member fails to meet either the fund or securities obligations, the exchange penalises the clearing member as described below, which may be passed on to the client. As a result, one must thoroughly understand the physical settlement process.
Mutual Fund

The NAV of a fund simply represents the value of the fund's portfolio. A lower NAV does not necessarily indicate a cheaper or worse fund. The NAV of a fund is calculated after deducting expenses such as the fund's expense ratio. As a result, the lower the NAV, the better the fund.
"mutual fund" means a trust established to raise funds through the sale of units to the public or a segment of the public under one or more schemes for investing in securities, money market instruments, gold or gold-related instruments, real estate assets, and such other assets and instruments as the Board may specify from time to time."
In layman's terms, a mutual fund is essentially a shared pool of money into which investors contribute. This total sum is then invested in accordance with the fund's investment goal.
What is NAV?
The fundamental understanding of mutual funds would be incomplete if the accounting principles underlying it were not adequately understood, which includes, among other things, the valuation of schemes and the determination of net asset values. "NAV is the mutual fund's price per unit value." Mutual funds are generally priced in a manner similar to how equities are priced. So, if an investor buys one unit of a mutual fund, he does so on the basis of the applicable NAV.
What Is the Distinction Between NAV and Market Price?However, unlike stock prices, which fluctuate by the second during stock market trading, mutual fund NAV does not alter during the day. The NAV, on the other hand, changes daily and is calculated after the markets close. As a result, it is critical for an investor to understand when the fund is priced, as this can affect the buy or redemption price. For example, if one purchases today, he may be acquiring at a NAV price that will occur at the conclusion of the next day
Bottom Line - Why Does NAV Matter?- • Because NAV reflects the price composition of all the securities held by a mutual fund in a scheme, when the prices of those securities are high, the fund NAV is high. If the overall price of these securities is low, the fund's NAV is low. As a result, it is a vital component to consider when investors are attempting to determine if their fund's value has increased or decreased. Unlike market traded stocks, the price of open ended funds does not fluctuate rapidly as a result of investor purchases or sales. This is due to the fact that a mutual fund has essentially no restrictions on the number of units it can issue at any given time.
- • As a certain mutual fund scheme continues to attract investor interest and money, the business will issue additional units for purchase, with the price per share determined by the securities in the portfolio. When a stock is in high demand, its price rises since supply is limited on the market for trading. However, there are times when the fund's size balloons to the point that fund managers decide to limit new investments into the programme.
- • In the case of a closed-ended scheme, the price of the fund units is determined by supply and demand. As a result, if the fund is traded at a price lower than the NAV, it is referred to as a "discount." Similarly, if the fund is traded at a price greater than its NAV, it is referred to as "premium."
- • It should be remembered that the NAV of mutual fund units fluctuates from day to day. Most mutual funds must be kept for extended lengths of time in order to be effective long-term investment solutions. It is rarely practicable for investors to try to trade open-ended funds in order to profit from swinging short-term funds. Furthermore, the NAV does not reflect the value of any interest or dividend paid to investors. As a result, it is critical for investors to examine the fund's overall return in order to properly comprehend its returns before making an investment.
- • When it comes to money markets, the NAV is relatively stable and does not move significantly as a result of day-to-day trading. They are generally liquid in nature, as their name implies.
- • There are some difficulties in calculating the applicable NAVs. Challenges emerge, for example, when an ETF owns securities in a different time zone, because NAV is based on the last price reported on the exchange at the time of its closure.
- • Despite all of the issues associated with computation and applicability criteria, it is evident that NAV is likely the most essential and relevant statistic for investors to utilise when making decisions about mutual fund investments.
Mutual Fund Ratios

The standard deviation of a data collection reflects its dispersion relative to its mean.Let us look at a basic example. Assume we have a portfolio that produced a 15% return in year one, a 5% loss in year two, and a 25% return in year three. Portfolio B delivered a 10% return in year one, an 8% return in year two, and an 11% return in year three. Who do you believe was more consistent? Is it A or B? Obviously, the answer is that B was more consistent, or that the deviation was smaller.
AlphaAlpha is a risk-adjusted measure of how an investment performs relative to the general market average return. The alpha is the difference between the loss and profit achieved in comparison to the benchmark.
Let us now define Alpha in basic terms.
Alpha refers to an investment manager's ability to outperform the market. Assume that the market's projected return is 10%, but the fund manager is able to achieve a return of 12%. The alpha in this situation is just 12 - 10 = 2.
(Alpha = Actual - Expected returns)
If we assume that a mutual fund's alpha is 1.5 percent, it signifies that the fund exceeded the benchmark by 1.5 percent. If the alpha is -1.5 percent, it signifies that the mutual fund returns were 1.5 percent lower than the benchmark.
So, which is superior? Is it better to have a greater alpha or a lower alpha? Obviously, the former. As a result, we should select a mutual fund with a greater alpha.
Treynor Ratio:This ratio was named after Jack Treynor, an American economist. It indicates how successful an investment is at compensating investors for taking an investment risk. To assess risk, it employs portfolio beta, which is the susceptibility of the portfolio's returns to market changes. Let's take a look at the formula:
Treynor ratio = Portfolio return minus risk-free return divided by Portfolio beta
Let us now attempt to comprehend this section.
What exactly is portfolio return?
It is solely the return generated by the portfolio for me. If I estimate an 11 percent return, then this is the portfolio return.
What exactly is a risk-free return?
It is the rate of return on investment in government securities. A risk-free return is so named because there is very little probability of losing money if I invest in a government asset. So, if I earn a 5% return after investing in a government asset, my risk-free return is 5%.
What exactly is a portfolio beta?
A beta is a measure of sensitivity to something. It might be the market sensitivity or the benchmark sensitivity. A portfolio beta is hence a market sensitivity.
Now that we've defined these concepts, let's look at an example.
Fund A has produced an 11 percent return, a 5% risk-free return, and a portfolio beta of 2. So, what is the Treynor ratio going to be? 11 - 5 divided by 2 equals 3.
What does this 3 represent? It means that for every additional unit of market risk assumed, the fund provided three units of return. Simply put, there is a relationship between the amount of risk you take and the amount of return you receive. That is, for one unit of risk, you received three units of return. This was the first case.
There is now a case 2. For one unit of risk, you received five units of return. And, when we compare the two, which do you believe is the best case? Obviously, the second option because it provides more profits for the same level of risk.
As a result, select a mutual fund with a greater Treynor ratio.
Sharpe Ratio:Many people believe that the Treynor and Sharpe ratios are the same. The numerator is, in fact, the same. The difference is in the denominator. While the Treynor ratio solely examines systematic risk, the Sharpe ratio incorporates both systematic and non-systematic risk.
So, what is the sharpe ratio formula?
It is calculated as follows: portfolio risk minus risk-free return divided by standard deviation.
Remember that the numerator is the same, and consider the following example:
Consider the following two investment managers: A and B.The investment manager A generated a 15% return, while the investment manager B generated a 12% return. What are your thoughts on who did better? Is it A or B?
Obviously, A, correct? But hold on! Let's take a closer look at the data.
The risk-free return is the same for both of them - 5%. Manager A's portfolio has an 8 percent standard deviation, while Manager B's portfolio has a 5 percent standard deviation. If we calculate A's Sharpe ratio, we get 15 - 5 divided by 8, which equals 1.25. Manager B, on the other hand, will have a sharpe ratio of 12 - 5 divided by 5, which equals 1.4. Which do you think is better based on this? Manager B, correct? Because she was able to earn a higher risk-adjusted return.
That is, for both the prior one and this one, we are attempting to determine how much more return can be generated with the same amount of risk. Again, it is preferable to select a mutual fund with a greater Sharpe ratio.
Expense Ratio:Let’s try to understand this. You invest money in a mutual fund, but the mutual fund also has its own expenses to bear. Like the fund management fee, the agents commission, registrar fees, auditor fees, advertising expenses and so many more. To manage these expenses the fund house charges fees for their services which is called the Expense Ratio. And SEBI has already set the limits for the Expense ratio.
SEBI has set a maximum annual limit of 2.5 percent for equity funds. It is 2.25 percent per year for debt funds. In the case of index funds, the rate is 1.5 percent every year. However, in the case of equity funds, SEBI has also established slabs for charging the expense ratio.
The rule is simple: the higher the AUM, the lower the expense ratio. This expenditure ratio is not paid individually, but is subtracted from your daily NAV, and it is charged regardless of whether a fund achieved a positive or negative return.
Mutual Fund Types in India
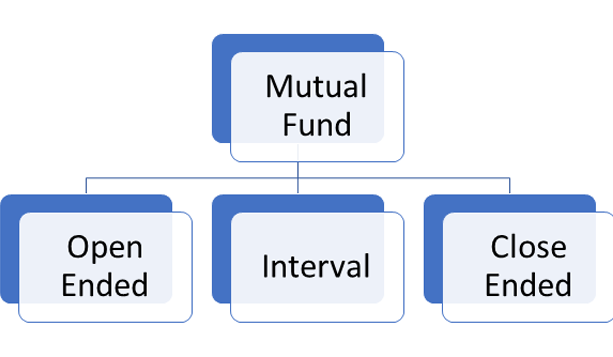
The mutual fund industry is always evolving. Several business organisations are also investing in investor education. However, according to a Boston Analytics report, less than 10% of our households consider mutual funds as an investment option.
In fact, a simple search for mutual funds reveals that these are possibly one of the most common.
most adaptable, comprehensive, and trouble-free investment modes that can accommodate various types of investment requirements

Various mutual fund categories are designed to allow investors to select a scheme based on their investment objectives on the level of risk they are willing to take, the amount of money they can invest, their goals, the investment term, and so on
- • Open Ended Funds
- • Closed Funds
- • Interval Funds Schemes
Based on Maturity Period
Open EndedThis scheme allows investors to purchase or sell units at any time. It also does not have a set maturity date. For investment and redemption, you deal directly with the Mutual Fund. The most important feature is liquidity. You can buy or sell your units at net asset value ("NAV")-related prices. The vast majority of mutual funds, approximately 59 percent, are open-end funds.
Close EndedThis type of scheme has a set maturity period, and investors can only invest during the initial launch period, which is known as the New Fund Offer (NFO).
No new investments are permitted after the offer closes. Because of the demand and supply situation, unit holders' expectations, and other market factors, the market price at the stock exchange may differ from the scheme's Net Asset Value (NAV).
Some closed-ended schemes will allow you to sell your units directly to mutual funds through periodic repurchase at NAV-related prices.
IntervalIt works as a hybrid of an open and closed ended scheme, allowing investors to trade units at predetermined intervals. They may be traded on a stock exchange, or they may be available for sale or redemption at predetermined intervals at NAV-related prices.
When deciding on an investment scheme, one should seek personalised advice. Choose the scheme that offers the best mix of growth, stability, and income while keeping your risk tolerance in mind.
Mutual Fund Schemes
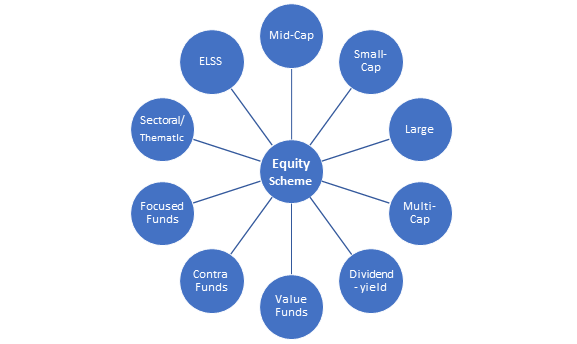
One of the most important points in the circular is that different Mutual Fund schemes should have distinct investment strategies and asset allocations. The schemes will be divided into the following categories.
- 1. Equity Plans
- 2. Debt Consolidation Schemes
- 3. Hybrid Plans
- 4. Solution-Oriented Plans
- 5. Additional Schemes
The existing scheme type would be replaced by the new scheme type. Let's take a look at each scheme type.
Equity Plans
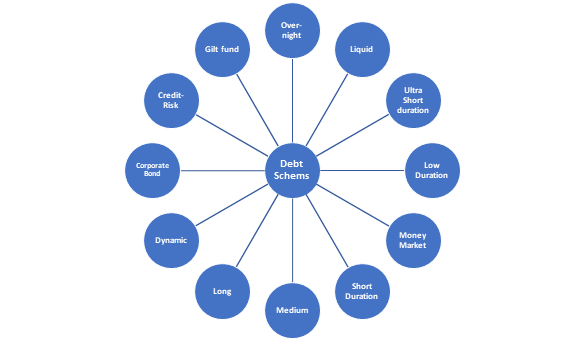
SEBI has established a total of 11 categories under Equity Schemes, but a mutual fund company can only have ten and must choose between Value and Contra. Still, ten categories seem excessive, but I believe it is reasonable given the potential variations in the strategy. To make things easier, SEBI has defined the terms Large Cap, Mid Cap, and Small Cap.
• Large Cap: the top 100 companies in terms of market capitalization; • Mid Cap: the 101st-250th companies in terms of market capitalization; and • Small Cap: the 251st and beyond companies in terms of market capitalization.
- 1. Multicap Mutual Funds
The minimum investment in equity and equity-related instruments is 65% of total assets. Multi Cap Fund - An equity mutual fund that invests in stocks from the Large Cap, Mid Cap, and Small Cap sectors. - 2. Large Cap Mutual Funds
Minimum investment in large cap companies' equity and equity-related instruments – 80% of total assets Large Cap Fund - An equity mutual fund that invests primarily in large cap stocks. - 3. Large and mid-cap funds
Minimum investment in large cap companies' equity and equity-related instruments - 35% of total assets Mid-cap stocks require a minimum investment of 35% of total assets in equity and equity-related instruments. Large & Mid Cap Fund – A mutual fund that invests in both large and mid-cap stocks. - 4. Mid Cap Mutual Funds
Mid-cap companies must invest at least 65 percent of their total assets in equity and equity-related instruments. Mid Cap Fund - A mutual fund that invests primarily in mid-cap stocks. - 5. Small Cap Mutual Funds
Small cap companies must invest at least 65 percent of their total assets in equity and equity-related instruments. Small Cap Fund - An equity mutual fund that invests primarily in Small Cap stocks. - 6. Dividend Yield Mutual Funds
The scheme should primarily invest in dividend-paying stocks. Minimum equity investment – 65% of total assets An equity mutual fund that primarily invests in dividend-paying stocks. - 7. Value Funds*
Scheme should follow a value investment strategy. Minimum investment in equity & equity related instruments - 65% of total assets An equity mutual fund following a value investment strategy - 8. Contra Funds*
Scheme should follow a contrarian investment strategy. Minimum investment in equity & equity related instruments - 65% of total assets An equity mutual fund following contrarian investment strategy - 9. Focused Funds
A scheme focused on the number of stocks (maximum 30) Minimum investment in equity & equity related instruments - 65% of total assets An equity scheme investing in maximum 30 stocks (mention where the scheme intends to focus, viz., multi cap, large cap, mid cap, small cap) - 10. Sectoral or Thematic Funds
Minimum investment in equity and equity-related instruments of a specific sector/theme – 80% of total assets An open-ended equity scheme . - 11. ELSS Funds theme.
The minimum investment in equity and equity-related instruments is 80% of total assets (in accordance with Equity Linked Saving Scheme, 2005 notified by Ministry of Finance) An open-ended equity-linked savings plan with a three-year statutory lock-in period and a tax benefit.
Debt Schemes
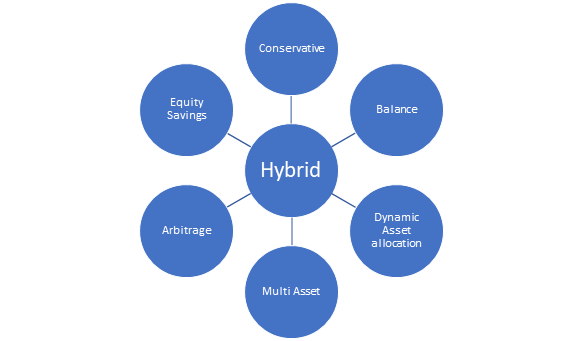
SEBI has established a total of 16 debt schemes categories. From the perspective of a retail investor, 16 categories are very high for debt funds due to their similarity in risk and returns. Overnight Fund and Liquid Fund are two similar categories. The same is true for the money market and ultra-short term debt fund categories.
1. Overnight FundsInvesting in one-day maturing overnight securities A debt scheme that invests in short-term securities.
2. Liquid FundA liquid plan Only invest in debt and money market securities with maturities of up to 91 days.
3. Ultra Short Duration Fundsinvest in debt and money market instruments so that the portfolio's Macaulay duration is between 3 and 6 months. An ultra-short term debt scheme that invests in instruments with a Macaulay duration of 3 to 6 months.
4. Low Duration Funds Invest in debt and money market instruments so that the portfolio's Macaulay duration is between 6 and 12 months.
A low duration debt scheme that invests in instruments with Macaulay durations ranging from 6 to 12 months.
5. Money Market Mutual FundsInvesting in money market instruments with maturities of up to one year A debt strategy that invests in money market instruments.
6. Short Duration Fundinvests in debt and money market instruments with Macaulay durations ranging from one to three years. A short-term debt scheme that invests in instruments with Macaulay durations ranging from one to three years.
7. Medium Duration Fundsinvest in debt and money market instruments so that the portfolio's Macaulay duration is between 3 and 4 years. A medium-term debt scheme that invests in instruments with a Macaulay duration of three to four years.
8. Medium to Long Duration Fundinvests in debt and money market instruments so that the portfolio's Macaulay duration is between 4 and 7 years. A medium-term debt scheme that invests in instruments with Macaulay durations ranging from 4 to 7 years.
9. Long Duration Fundinvests in debt and money market instruments with a Macaulay duration greater than 7 years. A debt scheme that invests in instruments with a Macaulay duration of more than 7 years. Investing for the long term
10. Dynamic BondsA dynamic debt scheme that invests over time.
11. Corporate Bond Mutual FundsCorporate bonds must account for at least 80% of total assets (only in highest rated instruments) A debt scheme that primarily invests in the highest-rated corporate bonds.
12. Credit Risk fundsA debt scheme that invests in lower-rated corporate bonds. Corporate bonds must account for at least 65 percent of total assets ( investment in below highest rated instruments)
13. Banking and Public Sector Undertakings FundMinimum investment in bank debt instruments, public sector undertakings, and public financial institutions: 80% of total assets A debt scheme that invests primarily in debt instruments issued by banks, public sector undertakings, and public financial institutions.
14. The Gilt FundThe minimum investment in Gsecs is 80% of total assets (across maturity) A debt scheme that invests in government securities over time.
Gilt Fund with a constant duration of ten yearsMinimum investment in Gsecs - 80% of total assets, so that the portfolio's Macaulay duration is equal to 10 years. A debt scheme that invests in government securities and has a fixed maturity of ten years. The Floater Fund The minimum investment in floating rate instruments is 65% of total assets. A debt scheme that primarily invests in floating-rate instruments.
Hybrid schemes

SEBI has established a total of seven categories under Hybrid Schemes, but a mutual fund company can only have six, and they must choose between Balanced Hybrid Fund and Aggressive Hybrid Fund. Finally, SEBI has classified Arbitrage Fund as a Hybrid Fund.
1 Hybrid Conservative FundsInvestment in equity and equity-related instruments - between 10% and 25% of total assets; Investment in debt instruments - between 75% and 90% of total assets A hybrid mutual fund that primarily invests in debt instruments.
2.Balanced Hybrid FundsEquity and equity-related instruments account for 40-60% of total assets; debt instruments account for 40-60% of total assets. Arbitrage would be prohibited under this scheme. A 50-50 balanced scheme that invests in both equity and debt instruments. Equity and equity-related instruments account for between 65 and 80 percent of total assets in aggressive hybrid funds; debt instruments account for between 20 and 35 percent of total assets. The majority of balanced funds will fall into this category. A hybrid scheme that invests primarily in equity and equity-related instruments.
3. Balanced Advantage or Dynamic Asset Allocation FundsDynamic management of equity/debt investments This category includes all well-known balanced advantage or dynamic funds. A hybrid mutual fund that adjusts its equity exposure in response to market conditions.
4. Multi asset allocation fundsInvests in at least three asset classes, with a minimum allocation of 10% in each of the three asset classes. Foreign investment will be treated as a distinct asset class. A scheme that invests in three different asset classes.
5. Arbitrage fundsScheme based on the arbitrage strategy. Minimum equity and equity-related instrument investment - 65% of total assets A strategy that invests in arbitrage opportunities.
6. Equity SavingsA scheme that makes use of equity, arbitrage, and debt. The minimum investment in equity and equity-related instruments is 65% of total assets, and the minimum investment in debt is 10% of total assets. The minimum hedged and unhedged amounts must be specified in the SID. The Offer Document may also include asset allocation under defensive considerations.
Schemes for Solving Problems
Retirement Fund Scheme with a 5-year lock-in period or until retirement age, whichever comes first.
A retirement solution-oriented scheme with a 5-year lock-in period or until retirement age (whichever is earlier)
Children's Fund Scheme with a 5-year lock-in period or until the child reaches the age of majority, whichever comes first.
A children's investment fund with a 5-year lock-in period or until the child reaches the age of majority (whichever is earlier)
Other Plans Index Funds/ETFs
Minimum investment in securities of a specific index (being replicated/tracked) - 95% of total assets
A mutual fund that replicates/tracks any index.
2 FoFs (domestic and international)
The minimum investment in the underlying fund is 95% of total assets.
A mutual fund that invests in other mutual funds is known as a fund of funds.
What exactly is an Exit Load, and why is it imposed?

An exit load is the fee that AMCs (asset management companies) charge investors when they exit or retrieve their fund units. The primary reason for imposing an exit load is to discourage investors from withdrawing their investments before the lock-in period expires. Furthermore, the exit load fee may reduce the number of withdrawals from mutual fund schemes. However, not all funds charge investors an exit fee. As a result, when selecting a plan to invest in, keep the 'exit load' factor in mind.
Mutual Fund Exit LoadThe exit load in mutual funds is typically a percentage of the mutual fund's Net Asset Value (NAV). The net asset value of an entity is calculated by subtracting the value of its assets from the value of its liabilities. Typically, AMCs subtract the exit load from the total. The NAV and any remaining funds are credited to the investor's account.
For example, suppose the exit load on a one-year scheme is 2% and it is redeemed within 4 months, well before the agreed period of investment. As a result, an exit load enters the picture. If the fund's NAV is Rs.40 at the time of redemption, the exit fee will be 2% of Rs.40, which is equal to 0.8. The investor receives Rs. 39.20 after deducting this amount from the NAV. Furthermore, if the investor completes the funds' agreed-upon tenure, he or she will not be required to pay the exit load at the time of redemption.
How to Determine Exit Load in Mutual Funds
Exit load rates vary depending on the type of mutual fund; different mutual funds charge different exit loads.
Assume a Rs. 30,000 investment in a mutual fund scheme in January 2022. If the plan is redeemed before one year, there is a 1% exit load. The NAV is Rs. 100, implying that the investor owns 300 units.
If the investor wishes to redeem the units after four months, that is, in May 2022. In this case, the investor will pay an exit load calculated as follows:
Amount invested in January 2017
30,000
NAV at the time of investment
100
Units Bought
30000/100=300
NAV at the time of redemption
90
Exit Load
1% of (90*300)= 270
Final Redemption Amount
27000-270=26730
Exit Loads on Various Mutual Fund TypesThe exit load charged by various mutual funds varies. However, not all mutual funds charge an exit fee to investors. It is a good idea to look into the exit load of the mutual fund schemes in which you are interested. Let's look at some mutual fund rates.
- 1. Liquid funds typically have no entry or exit load. This means that investors can redeem their investments at any time, and the funds will be credited to their bank accounts the following day.
- 2. There may or may not be an exit load on debt funds. However, the expense can be avoided by adjusting the investment tenure to coincide with the time period for which the fund charges an exit load.
- 3. The same is true for equity funds. It varies, but it is typically around 1% if redeemed within the first 12 months. It varies, however, from AMC to AMC.
When it comes to SIP investing, most investors are perplexed by the concept of 'Exit Load.'
Exit load on SIP may differ slightly. Because each SIP investment is treated as a new purchase, an exit load may be applied based on your SIP instalment amount and redemption amount.
Mutual Fund Jargons
Systematic Investment Plan (SIP)

Sometimes known as SIP, is a service provided by mutual funds that allows investors to invest in a disciplined manner. SIP allows an investor to invest a set amount of money in a mutual fund scheme at predetermined intervals. The fixed amount can be as low as Rs. 500, and the pre-defined SIP periods can be weekly, monthly, quarterly, semi-annually, or annually. By investing via SIP, the investor invests in a time-bound manner without having to worry about market dynamics and stands to benefit in the long run due to average costing and the power of compounding.
Lumpsum
A lump sum mutual fund investment, as the name implies, requires the investor to invest a lump sum amount in any scheme of their choice. In other words, the investor invests the entire money in the preferred plan at the start of their investment period.
They can choose from a variety of equity, debt, hybrid, fixed income, index, specialist, or other types of mutual fund schemes based on their investing objectives and risk tolerance. After making the investment, the investor is allowed to withdraw the invested cash as well as the created returns as needed.
The AMC (Asset Management Company)
Individual funds are managed by an asset management company. A mutual fund is an Indian Trust Act-registered trust. It is the result of a sponsor's initiative. A sponsor is an individual who acts alone or in collaboration with a corporation to establish a mutual fund. The sponsor then hires an AMC to administer the fund's investment, marketing, accounting, and other duties. A single AMC can introduce various funds based on investing objectives. It is a pool in which monies are collected and properly invested, with returns dispersed equally.
Before beginning operations, all AMCs in India are required to register with SEBI.
Asset Under Management (AUM)
When you invest in a mutual fund, you entrust your money to experienced fund managers, who will invest on your behalf. The total amount handled by a mutual fund scheme is referred to as the plan's Asset Under Management (AUM). The AUM can be viewed at the fund, category, or AMC level, as well as at the industry level.
AUM, or Assets Under Management, is the entire amount of money in a mutual fund system. The scheme's fund manager is in charge of investing and managing this AUM on behalf of investors. Two things influence the AUM.
The first aspect to consider is net flows. If the fund is open ended, it will witness acquisitions and redemptions on a continuing basis. The net purchase is the excess of purchases over redemptions for any period, and it directly adds to the AUM. Furthermore, capital appreciation contributes to the AUM. For example, if the stock prices of your holdings rise, so will AUM. When interest rates fall, AUM rises in debt funds.
XIRR in Mutual Funds
XIRR is an abbreviation for Extended Internal Rate of Return. It is a way for calculating returns on mutual fund investments made at irregular intervals. Applying it to each instalment (and, if applicable, redemptions) yields the current value of the whole investment. XIRR is known as a single rate of return in mathematics.
In other words, you can use this mathematical approach to calculate consolidated returns when you buy or sell fund units at irregular intervals. XIRR stands for your actual return on investment.
While CAGR (Compound Annual Growth Rate) is beneficial for lump sum investments, XIRR (Extended Internal Rate of Return) is better for SIPs. Because you have money invested for different time periods, each SIP investment is treated as a separate investment.
For example, if you have a 5-year SIP, your first instalment will be considered for 5 years, your second instalment for 4 years 11 months, and so on. This means that each amount invested accumulates over a distinct time period.
This is taken into account by XIRR when calculating the CAGR of each SIP investment. These are then totalled to determine the overall CAGR. As a result, XIRR is related to CAGR in various ways.
Custodian
A custodian is any corporate firm that retains its customers' investment assets for protection in the financial markets. Custody services are provided by banks to a wide range of customers, including mutual funds, investment managers, retirement plans, insurance companies, foundations, and agency accounts. A mutual fund custodian is just someone who looks after mutual funds.
To limit the chance of unscrupulous brokers taking advantage of the fund, the fund's assets, or underlying securities, are maintained with a third party. The custodian may additionally preserve fund records and manage other information as appropriate.
Investing: Basics

Anything which gives you a possibility of generating a positive return over your capital is an investment. Yes it is that simple, you buy a real estate and it’s value being expected to increase in future – it’s an investment, you have bought equity shares of a business and business is expected to grow and hence value of your equity shares , it is also an investment. You can think of anything as an investment if it is expected to generate a positive cashflow/ return to you in future.
What are the benefits of investing?The advantages of investing are numerous and varied. To understand why investing is vital, you must first grasp how investing affects your money in the long run. Let's look at an example to see how this works.
Let me introduce you to Shekhar. He is a 30-year-old man who saves approximately Rs. 20,000 per month. He dutifully saves the same amount each month, regardless of any increases in his monthly income or changes in his expenditure.
Consider the following two possibilities.
Scenario 1:Shekhar puts aside Rs. 20,000 per month but does not invest it.
As a result, he saves Rs. 2,40,000 every year. He intends to retire at the age of 50. So, when Amit is 50 years old, he will have Rs. 48,00,000 in his savings account. Consider a different situation in which Shekhar invests his monthly funds rather than leaving them idle.
Scenario 2: He invests Rs. 20,000 each month in a scheme with a 12-percentage-point return.
He intends to retire when he reaches the age of 50.
But this time, his money would rise to Rs. 1,99,82,958 at the end of 20 years.
That's almost two crores of rupees!
Because Shekhar simply invested the money he saved each month, he was able to make a profit of roughly Rs. 1.5 crores (Rs. 1,51,82,958).
Returning to the original question, why invest? There are a couple of strong reasons to invest.
- 1. Fight Inflation - By investing, one can better deal with the unavoidable — rising living costs, also known as inflation.
- 2. Create Wealth - By investing, one can hope to have a larger corpus at the conclusion of the time period specified. The time period in the preceding example was from birth to retirement, but it could be anything - children's schooling, marriage, home buying, retirement vacations, and so on.
- 3. To achieve one's financial goals in life
Types Of Investment Instruments
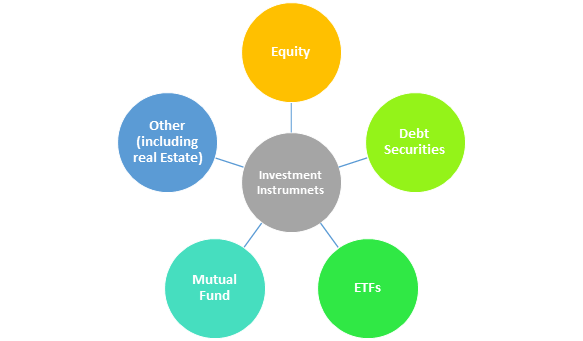
The following are the various types of investment instruments: -
Equities:
Equity refers to the portion of a company's ownership held by shareholders. It refers to a financial investment in the company's equity stock in order to become a shareholder in basic terms.
Equity investors do not get regular payments, but they can profit from capital gains by selling their holdings. Furthermore, equity holders gain ownership rights and become part of the company's ownership.
Debt securities:-
There are two types of debt securities: bonds and debentures.
1)Bonds.
Bonds are fixed-income instruments used by the federal and state governments, municipalities, and even private companies to fund infrastructure development and other initiatives.
2)Debentures.
Debentures, unlike bonds, are unsecured investment options with no collateral backing.
ETFs
An ETF, or exchange-traded fund are a regulated exchange-traded fund that consists of a collection of securities. ETFs are commonly used to invest in stocks, bonds, commodities, currencies, or a combination of them. As an investor, you're purchasing a basket of assets rather than a single asset when you purchase an ETF. The number of shares you own in this regard determines your stake in the overall number of assets.
Mutual Funds
Mutual funds pool funds from a number of participants and invest them in bonds, stocks, and other assets. If you have a large long-term goal or retirement plan in mind, mutual funds are the ideal option. Mutual funds pool money from a number of different participants and invest it in bonds, stocks, and other assets. If you have a large long-term objective or retirement plan in mind and wish to diversify across financial instruments and protect against market volatility, mutual funds are the way to go.
What exactly is the stock exchange?
We make a substantial investment in equities in order to create inflation-beating returns. So, how do we go about investing in shares now that we've established that we will. Clearly, understanding the ecosystem in which equities function is necessary before we go any farther with this discussion.
We go to the stock market to shop for equity investments in the same way we go to the neighbourhood Kirana store or a supermarket to shop for our everyday needs. Everyone who wants to buy or sell stocks goes to the stock exchange.
Simply put, transacting means purchasing and selling. For all practical purposes, you can't purchase or sell shares in a public firm like Infosys without going through the stock exchanges.
The primary goal of the stock market is to make your transactions easier. So, if you're looking to buy a stock, the stock market can assist you find a seller, and vice versa.
Unlike a supermarket, the stock market does not have a physical location. It is available in electronic format. You use your computer to access the market electronically and conduct your transactions (buying and selling of shares).
It's also worth noting that you can access the stock market through a stockbroker, who is a registered intermediary. At a later time, we'll go into stockbrokers in further detail.
The stock markets in India are made up of two major stock exchanges. The Bombay Stock Exchange (BSE) and the National Stock Exchange (NSE) are the two stock exchanges in India (NSE). Aside from these two markets, numerous other regional stock exchanges, such as the Bangalore Stock Exchange and the Madras Stock Exchange, are being phased out and no longer play a significant role.
Exchange helps in price determination, so if you are buying shares of Veranda ltd from BSE it will show you a different price than NSE as the price determination is based on the volume and bid ask spreads.
Fun Fact: Earlier before electronics systems for trading were introduced the price difference were so huge that some of leading NBFCs were founded as an arbitrage firm to exploit this opportunity.
Stock Market Regulators
In India, the stock exchange regulator is called the Indian Stock Exchange Commission, sometimes called SEBI. SEBI aims to promote the development of stock exchanges, protect the interests of individual investors, and regulate the activities of market participants and financial intermediaries. In general, SEBI guarantees:
- 1) Stock Exchanges (BSE and NSE) operate fairly.
- 2) Stock brokers and sub-brokers do business fairly
- 3) Participants do not engage in unfair practices
- 4) Companies do not use the market to over-enrich themselves (e.g. -Satyam Computers)
- 5) The interests of small private investors are protected
- 6) Large investors with huge amounts of cash should not manipulate the market
- 7) Overall development of the market
Stock Market Participants
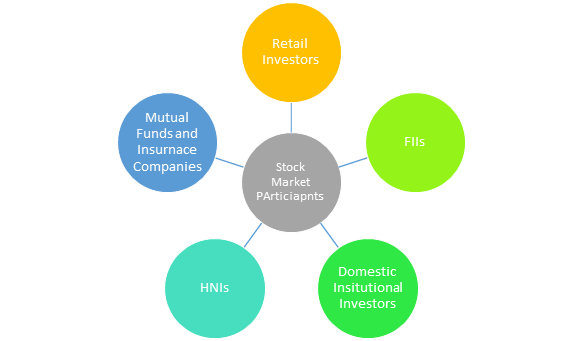
A market participant is someone who trades on the stock exchange. The market participant can be divided into several groups. The following are some examples of market participants:
Domestic Retail Participants - These are ordinary folks like you and me who buy and sell in markets.
NRIs and OCIs are people of Indian ancestry who live outside of India.
Domestic Institutions – These are large Indian-based corporations. The LIC of India is a classic example.
Asset Management Companies (AMC) in the United States – Mutual fund companies like SBI Mutual Fund, DSP Black Rock, Fidelity Investments, HDFC AMC, and others are typical participants in this category.
Non-Indian corporate entities are foreign institutional investors. Foreign asset management firms, hedge funds, and other investors could be among them.
| Entity | Example of companies | What do they do? | In simpler words |
|---|---|---|---|
| Credit Rating Agency (CRA) | CRISIL, ICRA, CARE | They rate the creditworthiness of corporate and governments | If a corporate or Govt entity wants to avail the loan, CRA checks if the entity is worthy of giving a loan |
| Debenture Trustees | Almost all banks in India | Act as a trustee to corporate debenture | When companies want to raise a loan, they can issue debenture against which they promise to pay interest. The public can subscribe to these debentures. A Debenture Trustee ensures that the debenture obligation is honoured |
| Depositories | NSDL and CDSL | Safekeeping, reporting and settlement of clients securities | Acts like a vault for the shares that you buy. The depositories hold your shares and facilitate the exchange of your securities. When you buy shares these shares sit in your Depositary account usually referred to as the DEMAT account. This is maintained electronically by only two companies in India |
| Depository Participant (DP) | Most of the banks and few stockbrokers | Act as an agent to the two depositories | You cannot directly interact with NSDL or CDSL. You need to liaison with a DP to open and maintain your DEMAT account |
| Foreign Institutional Investors | Foreign corporate, funds and individuals | Make investments in India | These are foreign entities with interest to invest in India. They usually transact in large amounts of money, and hence their activity in the markets have an impact in terms of market sentiment |
| Merchant Bankers | Axis Bank, Edelweiss Capital | Help companies raise money in the primary markets | If a company plans to raise money by floating an IPO, then merchant bankers are the ones who help companies with the IPO process |
| Asset Management Companies (AMC) | HDFC AMC, Reliance Capital, SBI Capital | Offer Mutual Fund Schemes | An AMC collects money from the public, puts that money in a single account, and then invests that money in markets intending to make the investments grow and generate wealth. |
| Portfolio Managers/ Portfolio Management System (PMS) | Religare Wealth Management, Parag Parikh PMS | Offer PMS schemes | They work similarly to a mutual fund except in a PMS; you have to invest a minimum of Rs.25,00,000; however, there is no such cap in a mutual fund. |
| Stock Brokers and Sub Brokers | Tradeswift ,ICICI Direct | Act as an intermediary between an investor and the stock exchange | Whenever you want to buy or sell shares from the stock exchange, you have to do so through registered stock brokers. A sub-broker is like an agent to a stockbroker |
What Is An Initial Public Offering (IPO)?

An initial public offering is the process through which a private firm or corporation becomes public by selling a portion of its stock to the general public (IPO). An IPO is typically used to inject new equity money into a company, make current assets simpler to sell, raise future funds, or monetize existing stakeholder investments. Once the IPO is completed, the company's shares are listed and can be traded freely on the open market.
What are Grey Market Premium and Costak rates?
The grey market premium is just the price at which stocks are traded in the grey market.
For example, suppose the issue price of X shares is 400 rupees. If the grey market premium is 400 rupees, it means that people are willing to buy X shares for 800 rupees. (That is 400 + 400).
Example of this work, Liddy is a stock broker. For future IPOs, 400 shares will be allocated at a specific issue price. On the other hand, other investors, so-called "buyers," believe that the value of a stock is much higher than the issue price.
These buyers are willing to pay a "premium" for grey market stock. Grey market traders contact investors like Liddy, the so-called "sellers". I decided to sell the shares at a specific price (premium) higher than the issue price. If Liddy likes the deal and doesn't want to take the risk of listing, she sells her stock and makes a profit. The
Kostak Rate is a premium you receive by selling your IPO application (in off-market transactions) to someone else before the issue is assigned or listed.
How are stocks traded?
In 1600, I bought 200 Infosys shares and decided to hold them for one year. How does it really work? What is the exact process of buying it? What happens after purchase?
Fortunately, there is a fairly well integrated system.
To make a decision to buy Infosys, you need to log in to your trading account (provided by a stock broker) and place an order to buy Infosys. When you place an order, an order ticket will be generated with the following details:
Infosys Trading Account Details for Buying Shares-Therefore, your identity will be disclosed. The price you want to buy Infosys
Number of shares you want to buy
Before the broker submits this order to the exchange, the broker must ensure that it has sufficient funds to purchase these shares. If so, this order ticket will come to the exchange. Once the order enters the market, the exchange seeks to find a seller who is willing to sell 200 shares of Infosys at 1600 (via the order matching algorithm).
Now the seller could be one who is willing to sell the entire 200 shares 1600, ten who sell 20 shares each, or two who sell one and 199 shares respectively. Sequences and combinations are not important. From your point of view, you need 1600 and 200 Infosys stocks and you ordered the same. The exchange guarantees that the stock will be available as long as there are sellers in the market.
Once the trade is executed, the shares will be electronically credited to your DEMAT account. Likewise, the shares will be electronically debited from the sellers DEMAT account.
What Is Depository?

Custodians are financial institutions that hold securities in electronic or DEMAT format. In general, custodians act as custodians. Any type of security can be included.
There are two CSDs in India. Central Depository Services India Limited (NSDL) is a subsidiary of National Securities Depository Limited (NSDL) (CDSL). Before the Indian stock market was fully computerized in the late 1990s, companies offered stock certificates to shareholders. In the hands of individual owners, these stock certificates provided security and were secure.
Following the introduction of electronic or screen trading in India, the National Securities Exchange established NSDL (National Securities Depository Limited) in 1996 under the Depository Act (1996). Central Depository Services India Limited or CDSL was founded in February 1999. How is NSDL different from CDSL? There is no big difference. National Stock Exchange, IDBI Bank, Ltd. And Indian unit trusts are all NSDL partners. The Bombay Stock Exchange, on the other hand, supports CDSL.
What Are Their Functions?

When you give a broker a purchase order, the broker processes it and tells the depositary (NSDL/CDSL) to transfer the specified amount of shares to your Demat account. You may have noticed that NSDL and CDSL send you a "monthly statement" that includes all of your trades and transactions for the previous month if you have a trading account. The depositary keeps track of all of the demat accounts it handles, as well as the transactions that take place within them.
A depository is a place to store something for storage or protection, or an institution such as a bank or savings and loan association that accepts deposits from consumers. A custodian is a company, bank, or other entity that holds securities and facilitates transactions. How similar is a custody account to a banking system account?
How banks keep their money safe. The storage system also keeps the securities safe. Like a bank, funds are held in an account with a unique number. Similarly, in the custody system, securities are held in an account with a unique ID.
Like banks, there is no physical handling of securities when allocating or transferring. At banks, funds are transferred between accounts. Similarly, the custody system involves the transfer of securities between accounts. Therefore, the deposit system is very similar to the banking system.
Depository Participant?
A depositary participant (DP) is an agent or authorized broker of a custodian bank. A custodian is a company or organization that owns and provides services related to an investor's securities through custodian participants. Holds electronic copies of investor securities such as stocks, debt securities, debt securities, bonds and investment trust stocks. It acts as a link between the issuing company and its shareholders.
You cannot contact the depository directly. One can open and maintain a Demat account in DP. They act as an intermediary between custodians and clients. An agreement between the two parties.
In India, Depositary Participants (DP) are called Depositary Agents. They act as an intermediary between custodians and clients. Under the Depositary Law, the relationship between the Democratic Party and the depositary body is governed by an agreement between the parties. In a strict legal sense, DP is a legal entity registered with SEBI under SEBI Act. Under the provisions of the law, DP may only provide deposit-related services after receiving a registration certificate from SEBI.
FAQ: Do I need to hold a minimum balance of securities in my DP account?Ans: No, investors do not need to hold a minimum deposit for this.
Market Jargons
This chapter aims to help you learn some of the common market terminologies and concepts associated with it.
Bull Market (Bullish) – If you believe that the stock prices are likely to go up,, you are bullish on the stock price. From a broader perspective, if the stock market index is going up during a particular time period, it is referred to as the bull market.
Bear Market (Bearish) – If you believe that the stock prices are likely to go down,, you are bearish on the stock price. From a broader perspective, if the stock market index is going down during a particular time period, it is referred to as the bear market.
Trend – The term `trend` usually refers to the general market direction and its associated strength. For example, if the market is declining fast, the trend is said to be bearish. If the market is trading flat with no movement, then the trend is said to be sideways.
Face value of a stock – Face value (FV) or par value of a stock indicates a share`s fixed denomination. The face value is important concerning a corporate action. When dividends or stock splits are announced, they are usually issued at par. For example, Infosys FV is 5, which means that if you announce an annual dividend of Rs.63 /, the dividend paid will be 1260% (63 divided by 5).
52-week highs / lows – 52-week highs are the highest points that stocks have traded in the last 52 weeks (which also marks a year), as well as 52-week lows have traded stocks. Mark the lowest points for the last 52 weeks. The 52-week highs and lows give a sense of the range in which stocks were traded in a year. Many believe that when stocks reach their 52-week highs, they are showing a foreseeable future upward trend. Similarly, if a stock hits 52 week low, some traders believe it indicates a bearish trend for the foreseeable future.
Alltime high/low – This is similar to the 52 weeks high and low, with the only difference being the alltime high price is the highest price the stock has ever traded from the time it has been listed. Similarly, the alltime low price is the lowest price at which the stock has ever traded from the time it has been listed.
Upper Circuit/Lower Circuit – The exchange sets up a price band at which the stock can be traded in the market on a given trading day. The highest price the stock can reach on the day is the upper circuit limit, and the lowest price is the lower circuit limit. The stock limit is set at 2%, 5%, 10%, or 20%, depending on the stock exchange's selection criteria. Exchanges set these limits to control excessive volatility when stocks react to specific news related to the company.
Long Position – Long position or going long is simply a reference to the direction of your trade. For example, if you have bought or intend to buy Biocon shares,, you are long on Biocon or planning to go long on Biocon, respectively. If you have bought the Nifty Index with an expectation that the index will trade higher then essentially you have a long position on Nifty. If you are long on a stock or an index, you are said to be bullish
Short Position – Going short or simply `shorting` is a term used to describe a transaction carried out in a particular order. This is a slightly tricky concept. To help you understand the concept shorting, I`d like to narrate a recent incident that happened to me at work.
Square off – Square off is a term used to indicate that you intend to close an existing position. If you are long on a stock squaring off the position means to sell the stock. When you are selling the stock to close an existing long position you are not shorting the stock
Intraday position – This is a trading position you initiate with an expectation to square off the position within the same day.
OHLC – OHLC stands for open, high, low and close. We will understand more about this in the technical analysis module. For now, open is the price at which the stock opens for the day, high is the + highest price at which the stock trade during the day, low is the lowest price at which the stock trades during the day and the close is the closing price of the stock. For example, the OHLC of ACC on 17th June 2014 was 1486, 1511, 1467 and 1499.
Volume – Volumes and their impact on stock prices are important concepts that we will explore in greater detail in the technical analysis module. Volumes represent the total transactions (both buy and sell put together) for a particular stock on a particular day
Market Segment – The market segment is the area in which certain types of financial instruments are traded. Each financial instrument is characterized by its risk and return parameters. The exchange operates in three major segments.
Capital Markets – The Capital Markets segment offers a variety of tradable securities, including stocks, preferred stock, warrants and exchange trading funds. The Capital Markets segment has subsegments into which products are further subdivided. For example, a company's common stock is traded under a stock segment abbreviated as EQ. Therefore, when buying or selling a company's stock, it basically belongs to the capital markets segment.
Futures and Options – Futures and Options, commonly referred to as equity derivatives segments, trade leveraged commodities. The Derivatives Module details the derivatives market.
Wholesale Bond Markets – The Wholesale Bond Market deals with fixed income. Debt certificates include government bonds, Treasury securities, bonds issued by public institutions, corporate bonds, and corporate bonds.


